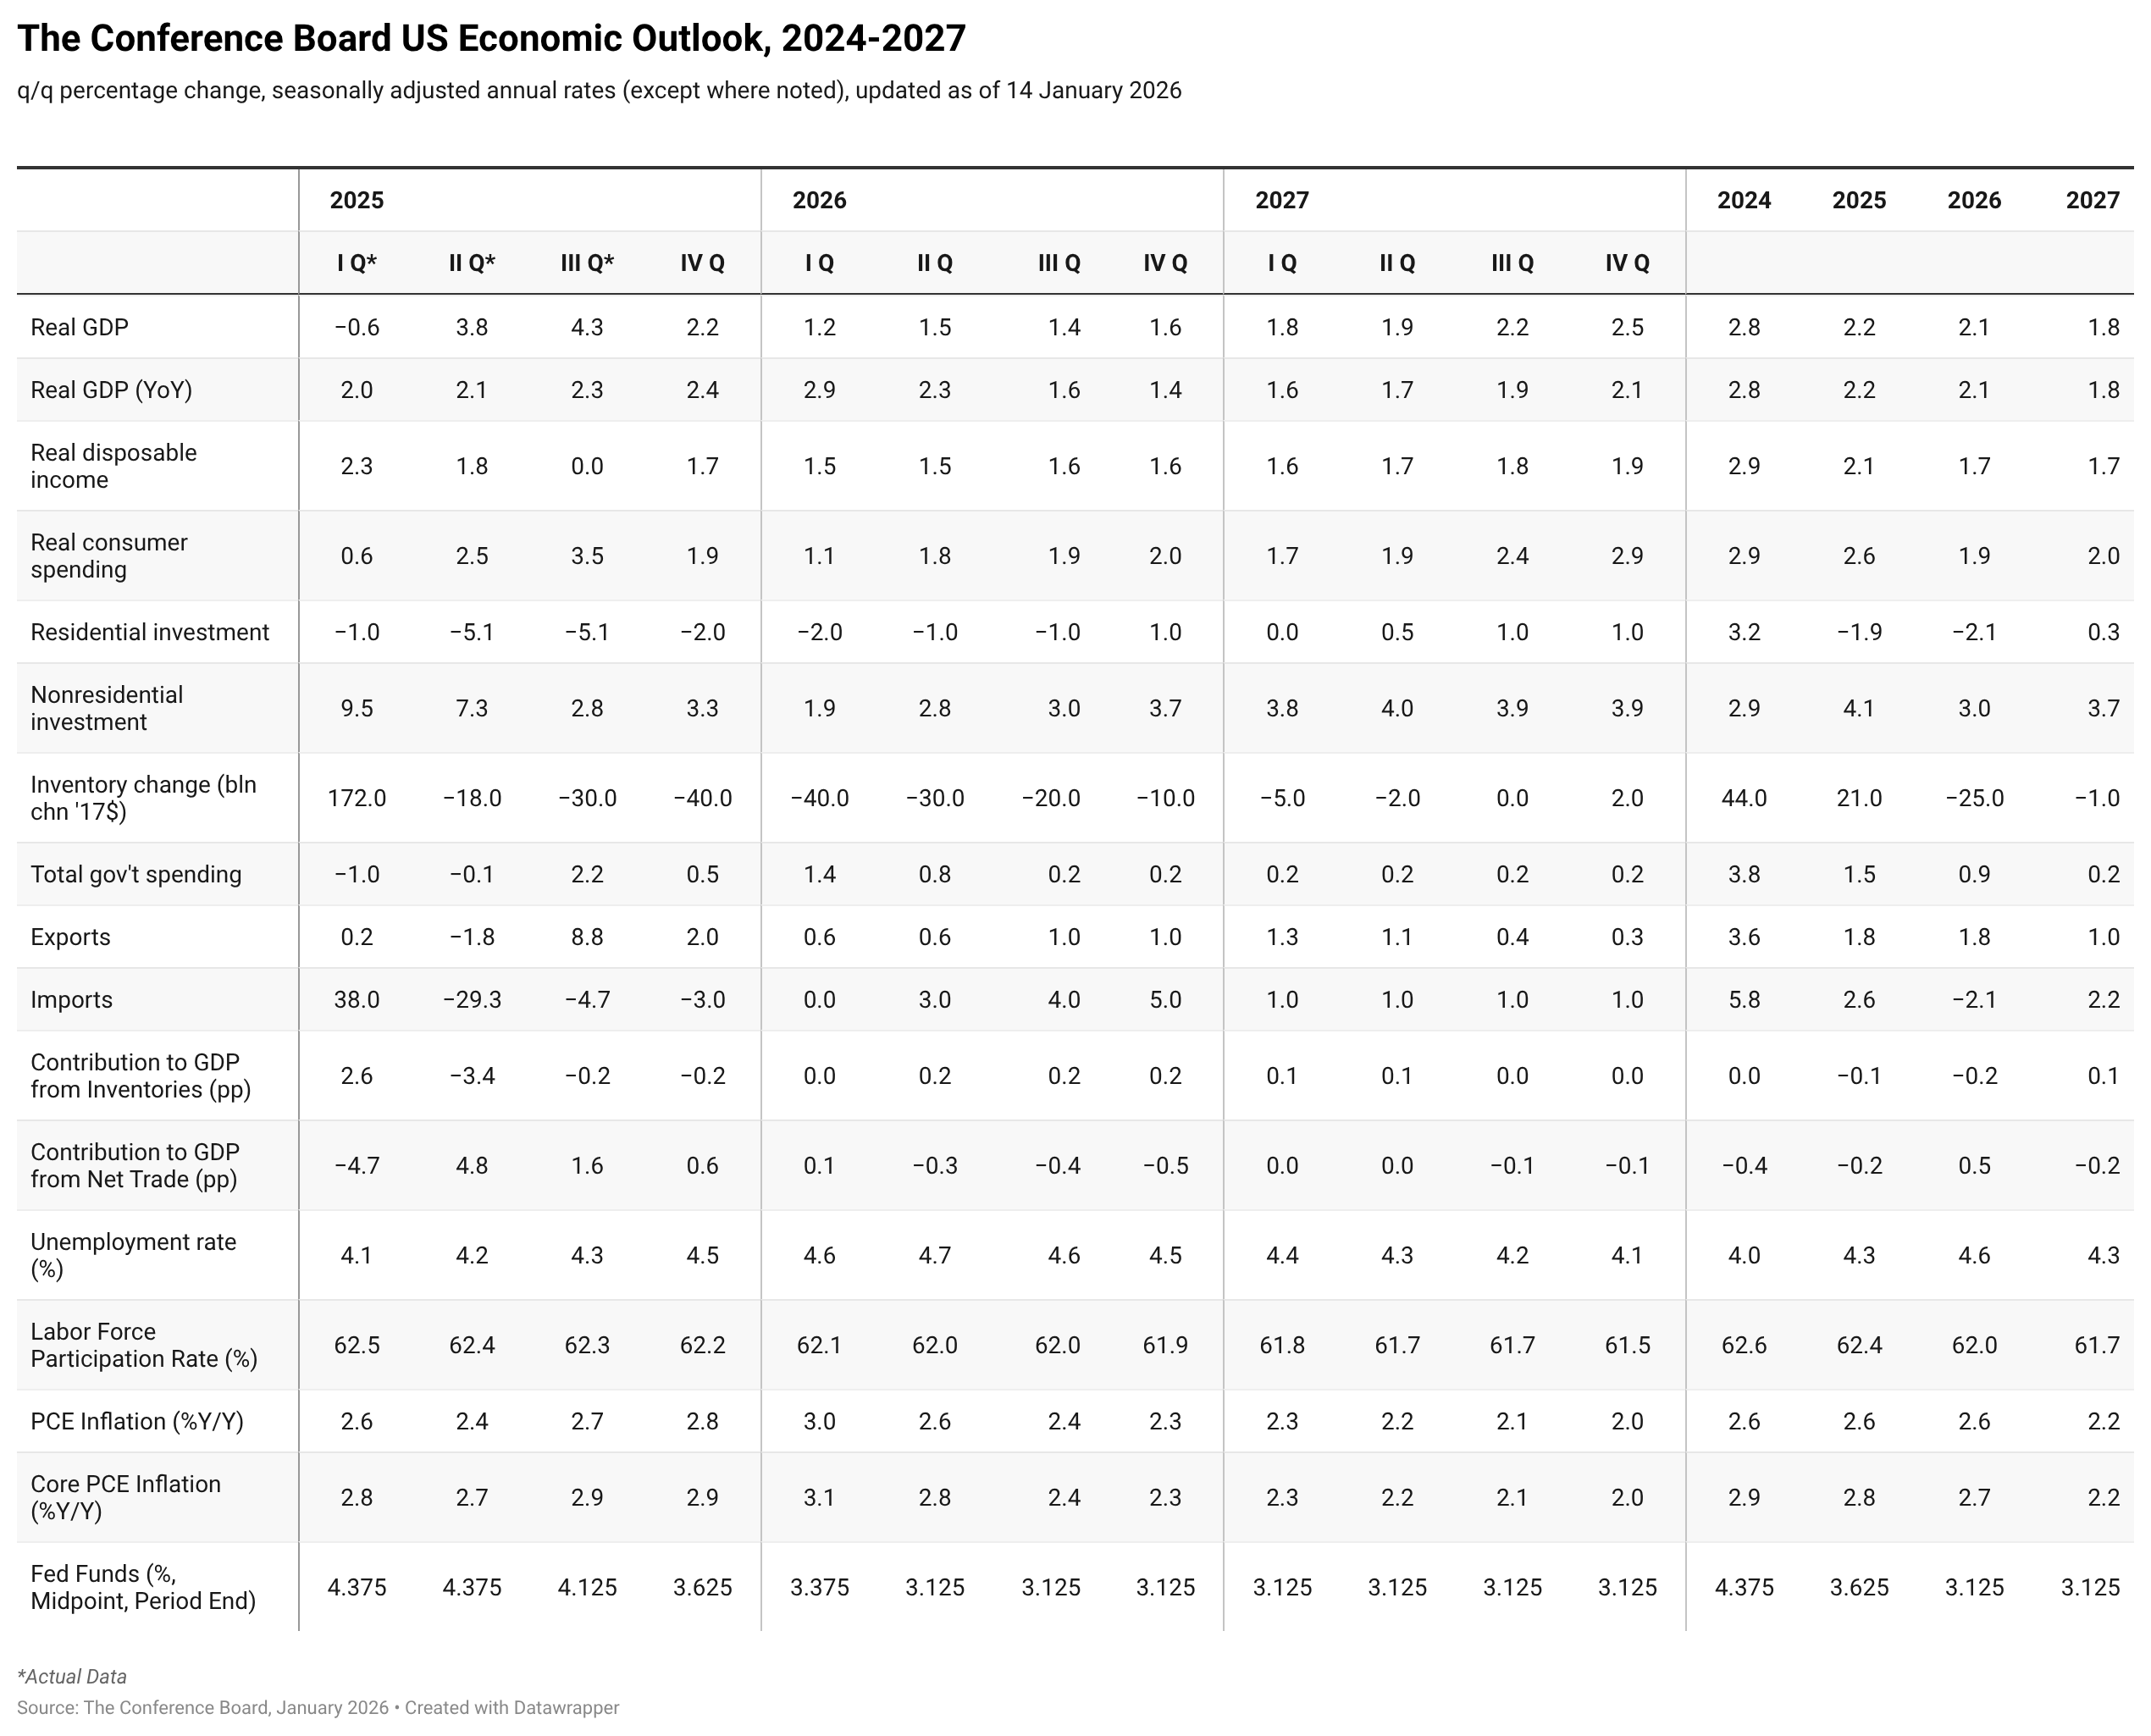
The US economy entered 2026 amid heightened uncertainty around evolving policy decisions. While The Conference Board maintains expectations of slower growth through late 2025 and early 2026 because of tariffs, there are sizable risks both to the upside and downside. Nevertheless, the projections for both years were upgraded following the publication of an outsized real GDP gain in Q3 2025 and a sharp narrowing in the trade deficit at the start of Q4 2025. Inventories likely experienced a sizable drawdown in H2 2025. However, missing data, due to the federal government shutdown, obscures real economic activity. This in turn complicates forecasting the evolution of the economy in 2026.Policy Crosswinds Raise Uncertainties around Growth Forecast

Fiscal policy will deliver mixed effects next year: growth support from accelerated depreciation and tax cuts will be partially offset by reduced green investment and cuts to Medicaid and Supplemental Nutrition Assistance Program (SNAP).
The monetary policy outlook will depend heavily on the composition of the Fed under a new chairperson. Recent events related to Fed independence may complicate new policymakers’ appointments this year and therefore increase the bands around possible interest rate outcomes.
The mid-term elections at the end of the year could prompt some federal government stimulus to address “affordability” concerns, creating upside risks to growth. Recent housing affordability initiatives and proposals to cap interest rates on consumer credit cards may result in unintended consequences for growth. Meanwhile, widespread hiring freezes and recent announced layoffs create downside risks to the current low-churn equilibrium in the labor

myTCB® Members get exclusive access to webcasts, publications, data and analysis, plus discounts to events.

Charts
The Gray Swans Tool helps C-suite executives better navigate today’s quickly developing economic, political, and technological environments.
LEARN MORECharts
Preliminary PMI indices show no change in weak DM growth momentum in November
LEARN MORE
Charts
How Might the World Fall Back into Recession?
LEARN MORECharts
Passing increases downstream, cutting costs, and absorbing price increases into profit margins are the chief ways to manage rising input costs. Few see changing
LEARN MORECharts
US continues to lead global productivity race
LEARN MORECharts
The Global Economic Fallout of the Ukraine Invasion
LEARN MORECharts
The global supply chain disruption associated with the COVID-19 pandemic has resulted in production delays, shortages, and a spike in inflation in world.
LEARN MORECharts
The Conference Board recently released its updated 2022 Global Economic Outlook.
LEARN MORE


PRESS RELEASE
LEI for the Global Economy Decreased in October and November
January 29, 2026
PRESS RELEASE
LEI for China Declined in December
January 28, 2026
PRESS RELEASE
US Consumer Confidence Fell Sharply in January
January 27, 2026
PRESS RELEASE
LEI for India Ticked Down in December
January 26, 2026
PRESS RELEASE
The Conference Board Leading Economic Index® (LEI) for the US Declined in Both O
January 23, 2026
PRESS RELEASE
The LEI for France Ticked Up in November
January 22, 2026
All release times displayed are Eastern Time
Note: Due to the US federal government shutdown, all further releases for The Conference Board Employment Trends Index™ (ETI), The Conference Board-Lightcast Help Wanted OnLine® Index (HWOL Index), The Conference Board Leading Economic Index® of the US (US LEI) and The Conference Board Global Leading Economic Index® (Global LEI) data may be delayed.
This report identifies trends to help businesses prepare for an environment with more challenges for labor and capital but improvements in productivity growth.
LEARN MOREConnect and be informed about this topic through webcasts, virtual events and conferences
The Conference Board Economic Forecast for the Euro Area Economy
February 06, 2026 | Article

Vacancies Plunge, But Low Hire-Low Fire Equilibrium Persists
February 05, 2026 | Brief

FOMC Reaction: US Economy In a Good Place, But Staying Vigilant
January 28, 2026 | Brief

Economy Watch: US View (January 2026)
January 23, 2026 | Article
The Conference Board Economic Forecast for the US Economy
January 14, 2026 | Article

The CEO Outlook for 2026—Uncertainty, Risks, Growth & Strategy
January 15, 2026

The Big Picture: What's Ahead for the Global Economy?
December 10, 2025

Economy Watch: Trends in Consumer & CEO Confidence
November 12, 2025

US Tariffs: What’s Changed, What’s Next
October 15, 2025

The Economic Outlook—Storms or Sunshine Ahead?
September 10, 2025

Economy Watch: US Public Policy and the Economy
April 09, 2025
