It was the best of times for goods, it was the worst of times for services
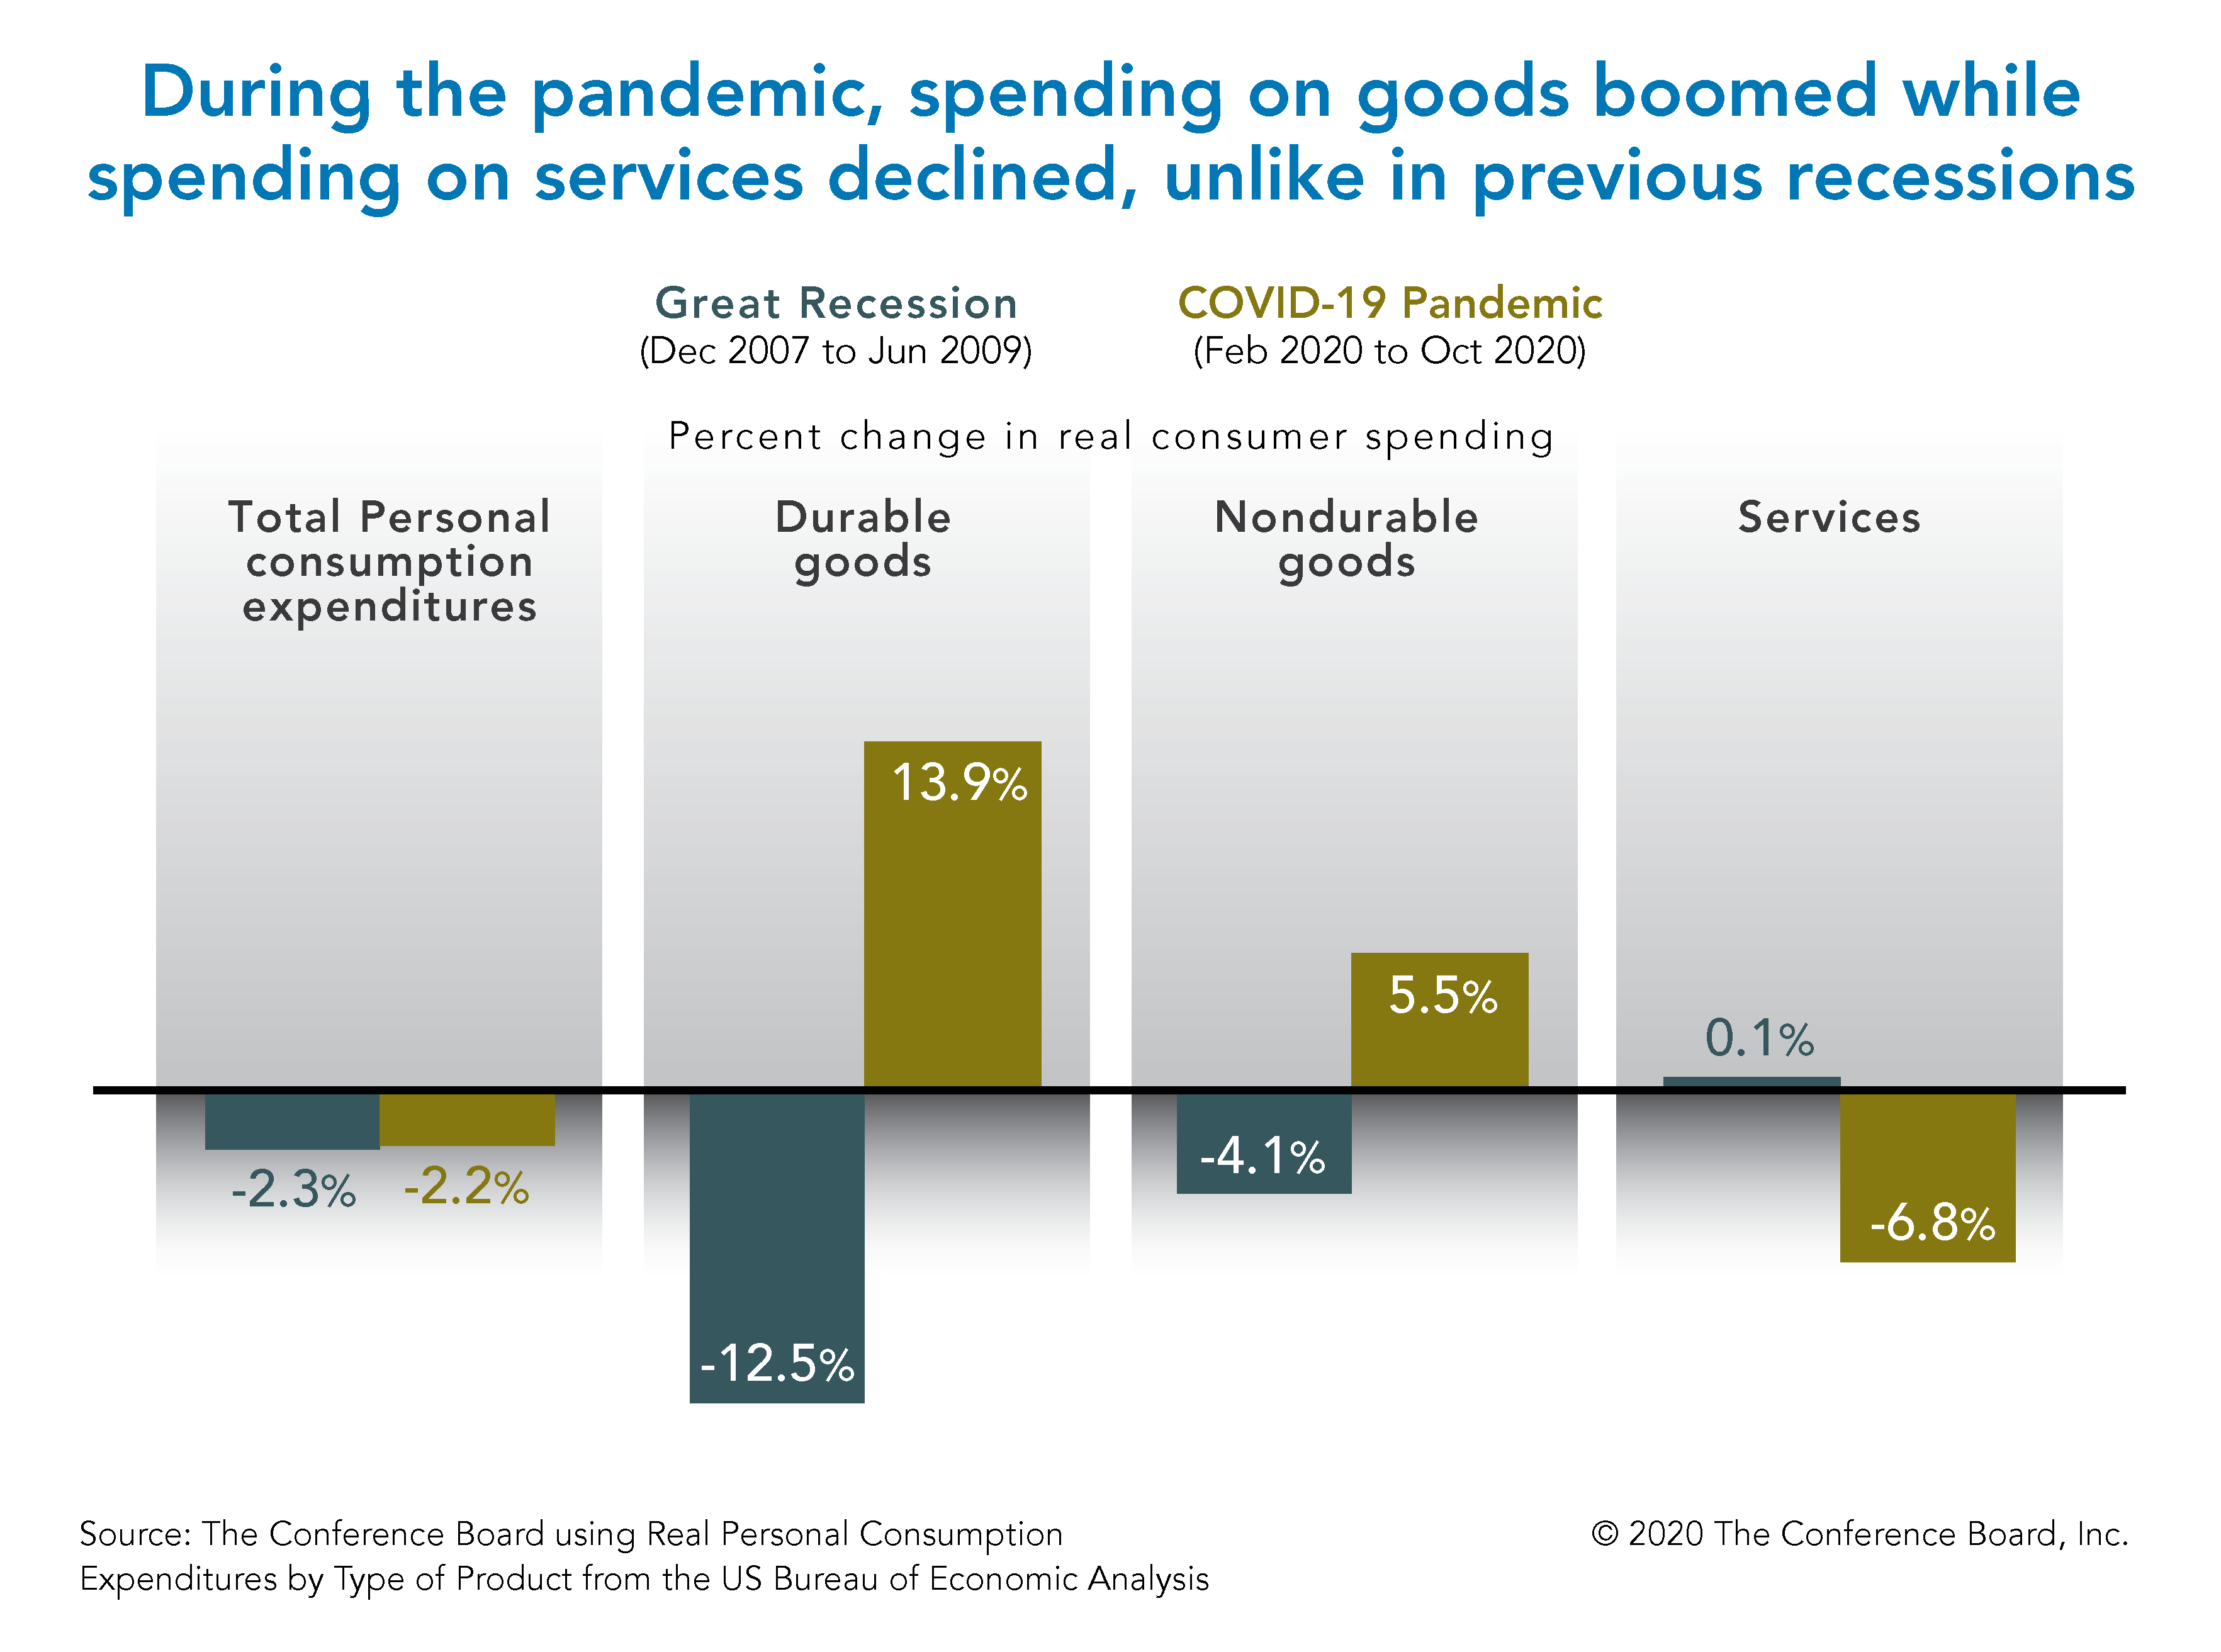
As in prior recessions, total household consumption collapsed amid the COVID-19 pandemic. However, unlike in past economic downturns, spending on services cratered, while spending on goods skyrocketed. Several factors contributed to the swell in goods consumption despite the pandemic-induced recession:
- Reduced consumption on services categories left households with additional funds to spend on goods—especially leisure-related goods like sports equipment, toys, and pets—and to increase savings.
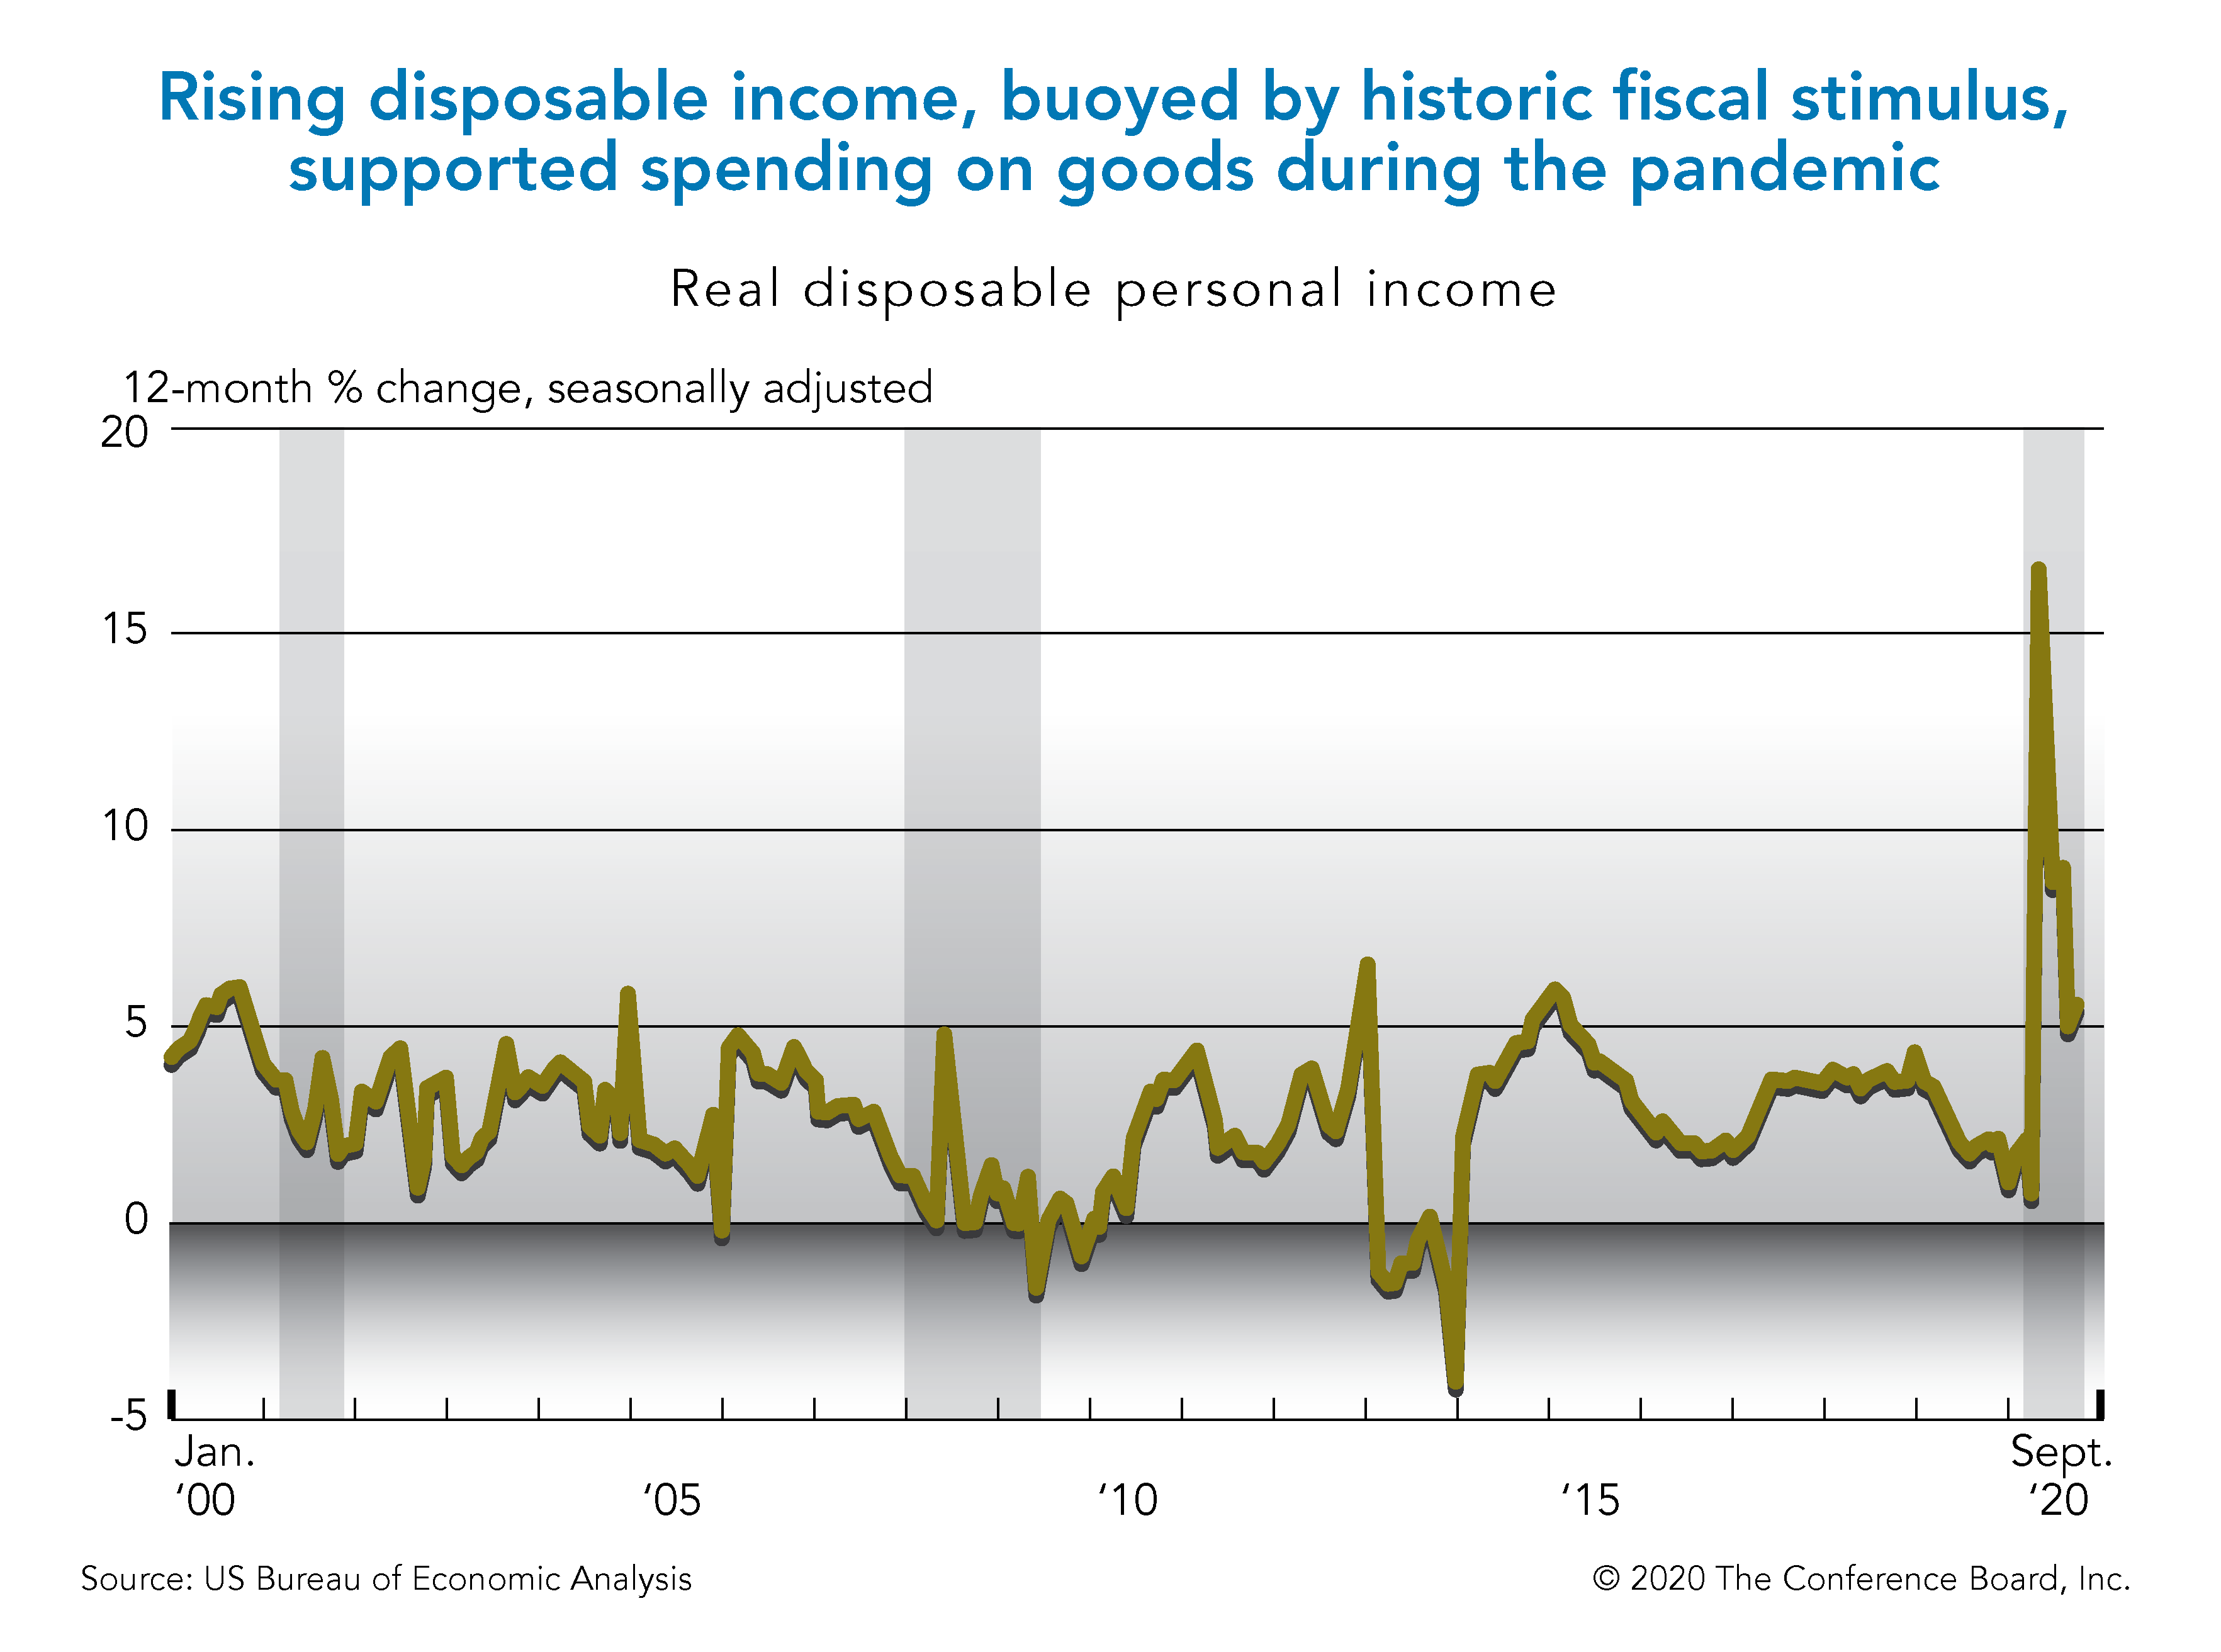
- The largest government stimulus in US history supported aggregate consumer spending. Despite the huge loss in labor income as job losses mounted, disposable personal income, adjusted for inflation, was bolstered by unemployment insurance benefits and direct transfer payments from governments.
- Increased home and stock prices improved perceptions of financial security and retirement preparedness, prompting consumers’ willingness to spend. In addition, the outsized strength of the housing market, fueled by pent-up demand, flight from city centers, and record low mortgage prices, supported spending on housing-related categories including appliances and furniture.
The historically large drop in services spending amid the pandemic was related to the inability and/or fear of consuming in-person services. In October 2020, consumer spending on overall services, adjusted for inflation, was about 7 percent below the February 2020 level (Chart 1). For comparison, during the entire Great Recession of 2008–09, real spending on services did not decline at all.
Chart 1
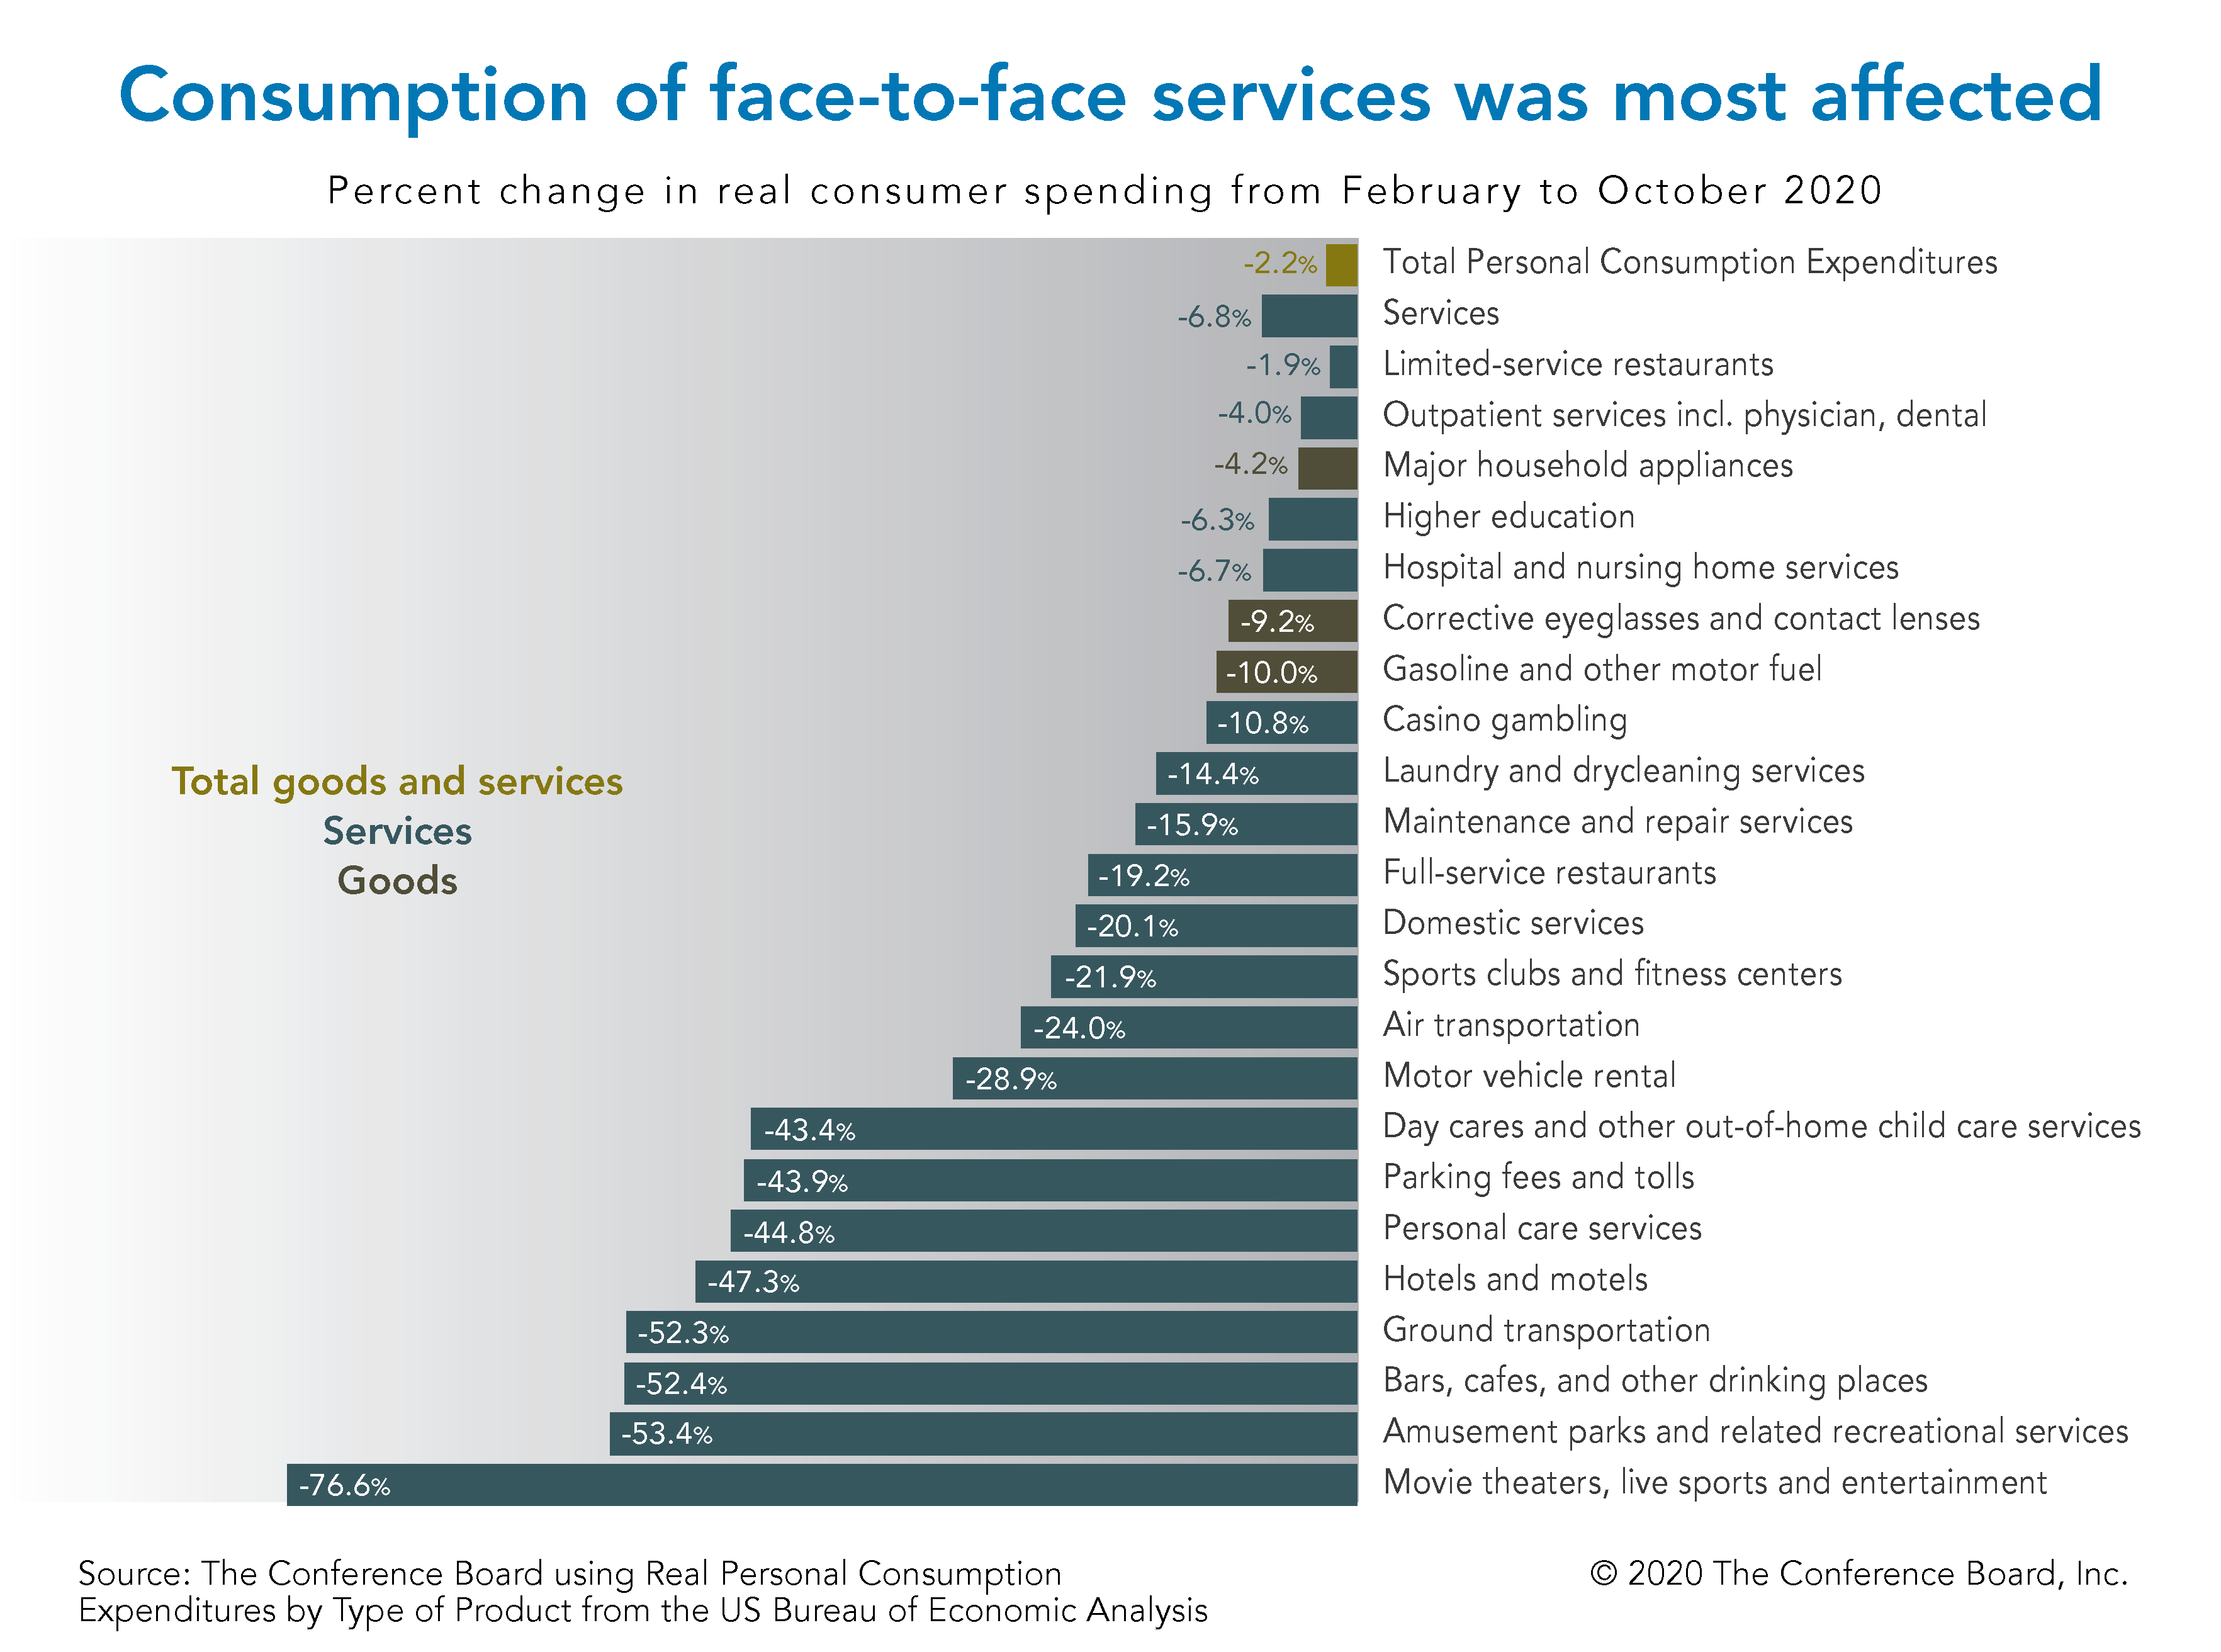
The most visible impact of restrictions on mobility and store closures was on categories including travel, entertainment, hotels, full-service restaurants and bars, personal care services, and child care. However, almost any services that involved performing activities in close proximity to others were negatively affected. For example, services involving cleaning, maintenance and repair workers entering homes, and health-related services that could be postponed, were hard hit.
Chart 2
Consumers shift spending from services to goods
Amid the collapse in services spending, a combination of fiscal supports and online retail platforms enabled a surge in goods spending. In October, consumer spending on goods, especially durable goods, was well above prepandemic levels. October’s retail sales data showed further expansion. In comparison, during the financial crisis, as in most recessions, spending on goods plummeted.
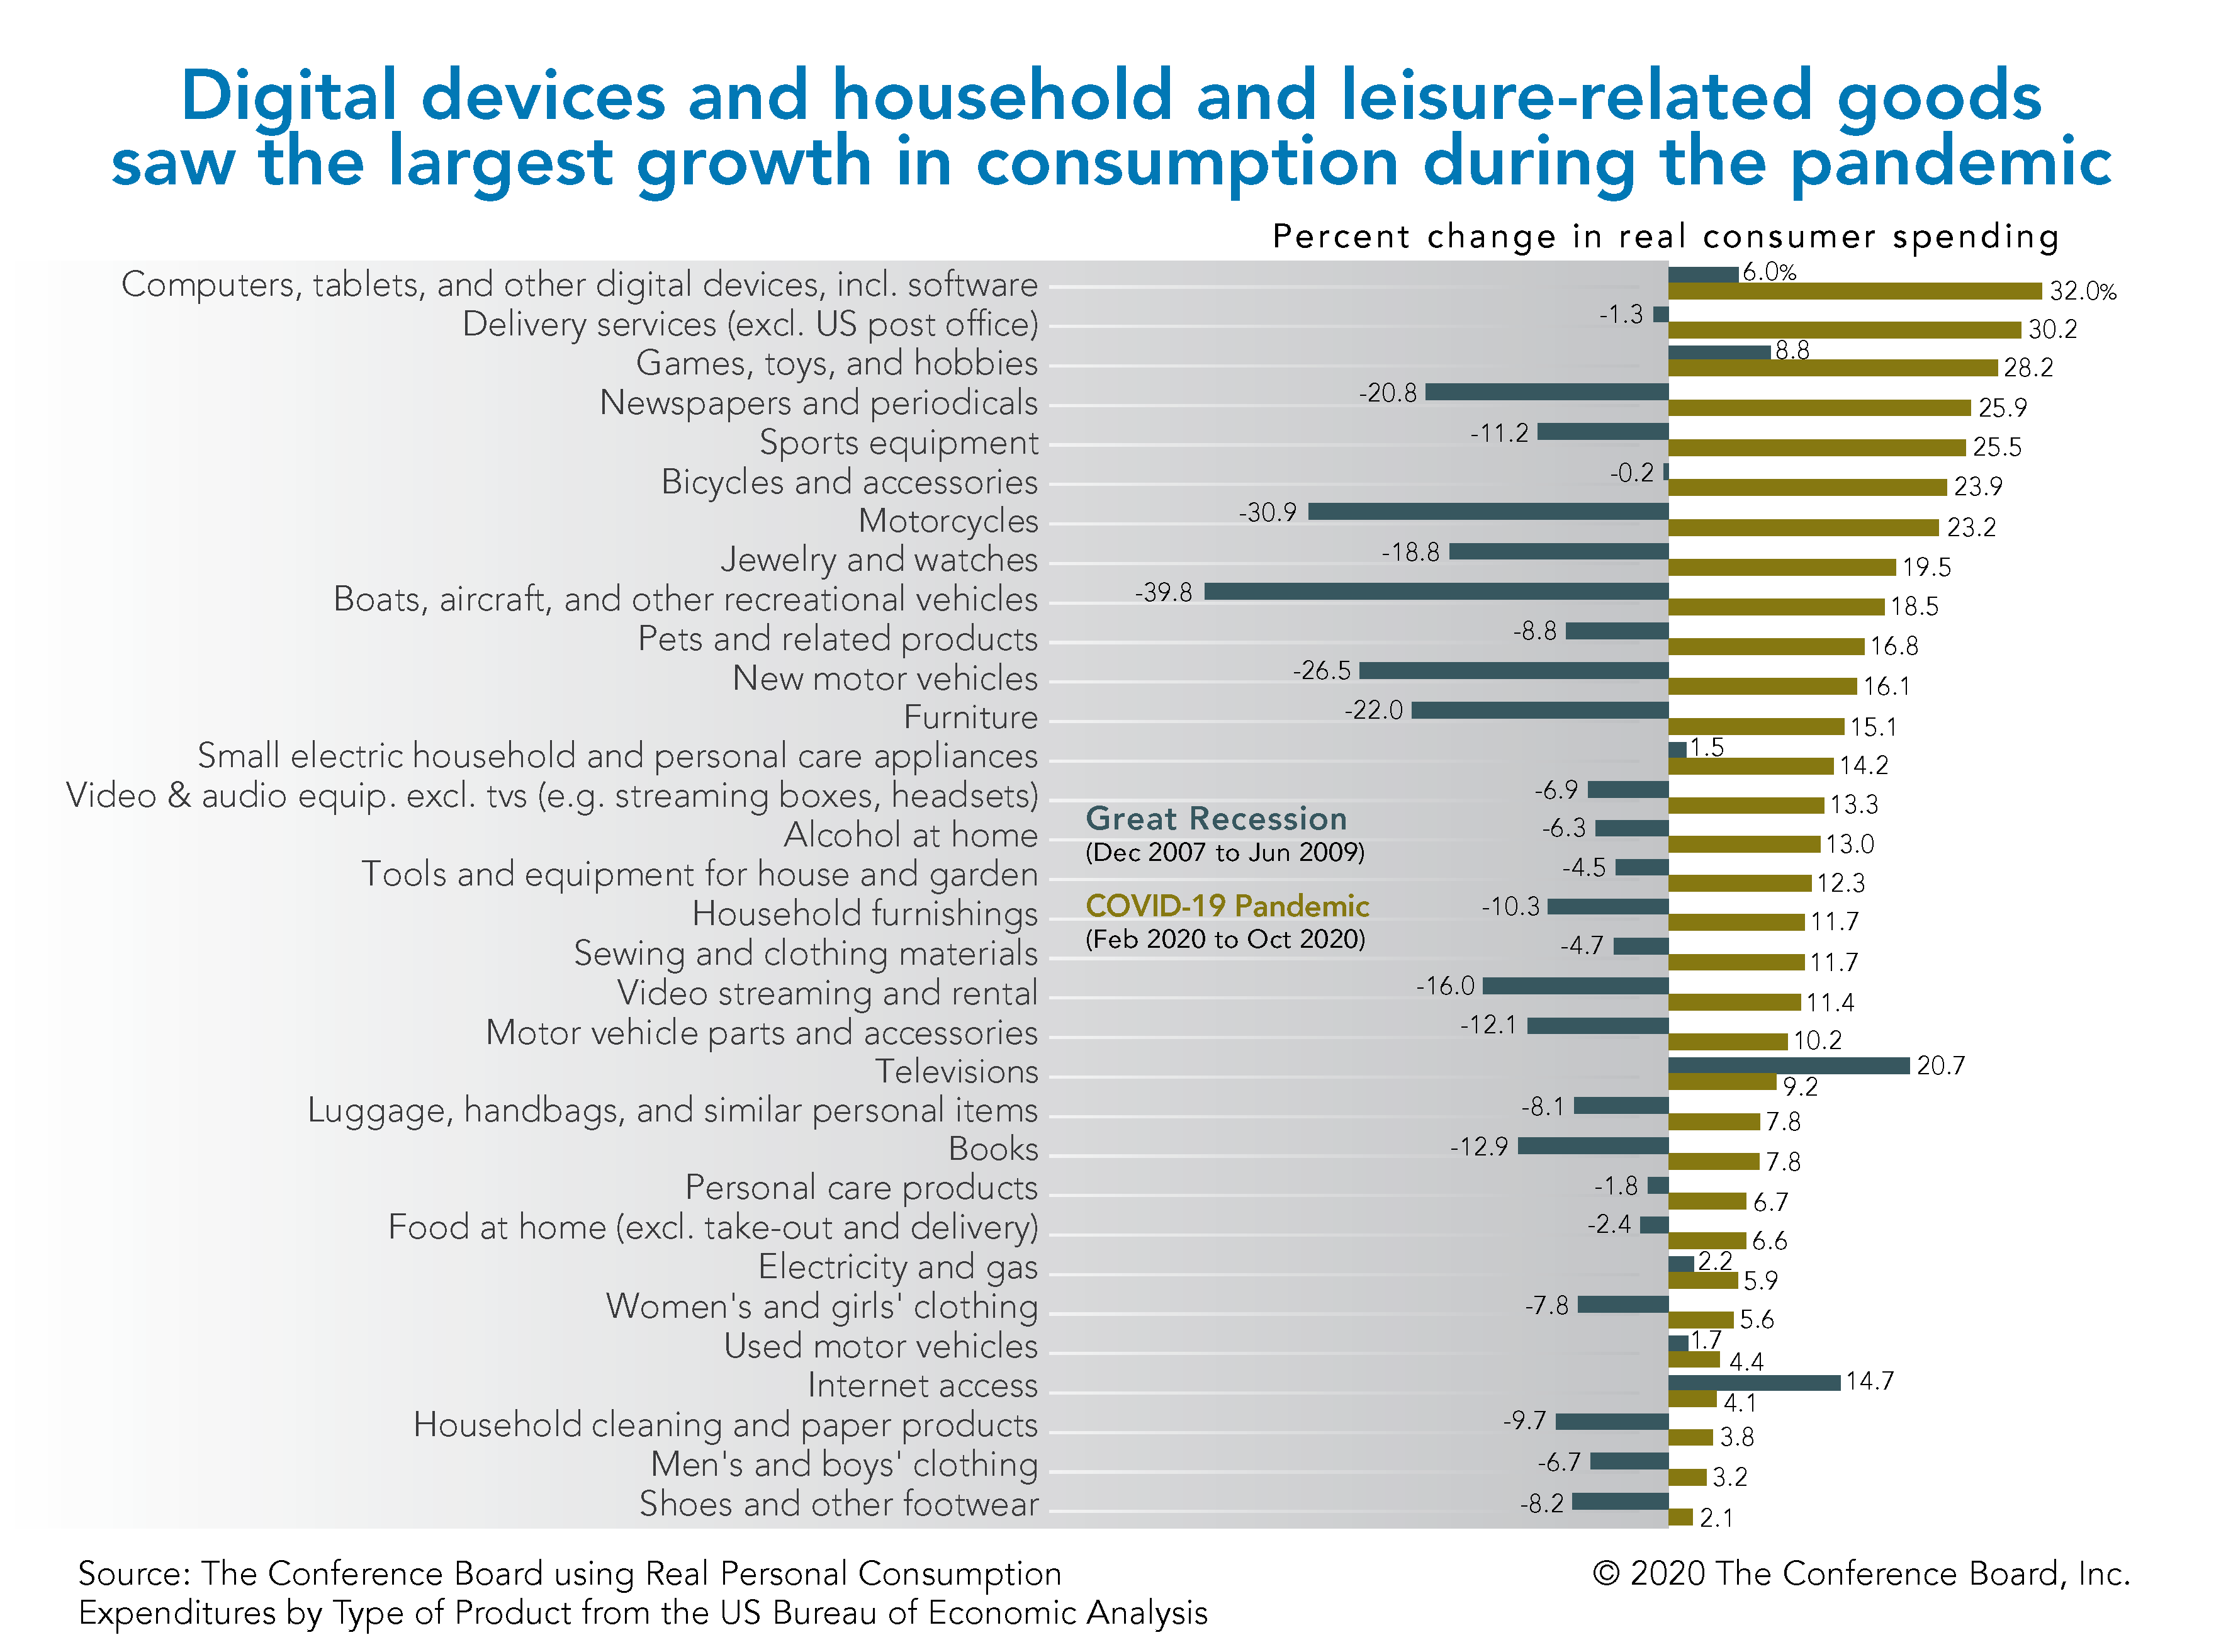
Goods categories that have experienced the fastest growth during the pandemic include digital devices as well as leisure-related goods, such as recreational vehicles, including motorcycles and bicycles; games, toys, and hobbies; sports equipment; newspapers and periodicals; and pets and related products (Chart 3). These leisure-related goods were typically very hard hit in previous recessions, so the current spending spree is a nice surprise for manufacturers and importers of these goods.
Spending on motor vehicles, another recession-sensitive category, also experienced a large spike, along with furniture, household furnishings, small household appliances, and tools and equipment for house and garden. The shutdown of many restaurants and bars led to a large increase in spending on food and alcohol purchased for at-home consumption. Spending on consumer staples, such as cleaning and paper products, also increased, often contributing to shortages amid the early days of the US pandemic.
Spending on jewelry and watches, another category that typically declines during recessions, also experienced growth throughout this crisis.
Chart 3
Fiscal stimulus, wealth effects, and robust housing activity, in addition to the reduction in services spending, also supported spending on goods during the pandemic.
The largest government stimulus in US history Overall consumer spending has been supported by the largest government stimulus in US history, reflecting sizable federal and state unemployment benefits, plus direct transfers from the federal government in the form of stimulus checks. Despite the huge loss in labor income as unemployment rates spiked, disposable personal income, adjusted for inflation, was higher during the pandemic than before it, providing US households with more funds for spending.
Chart 4
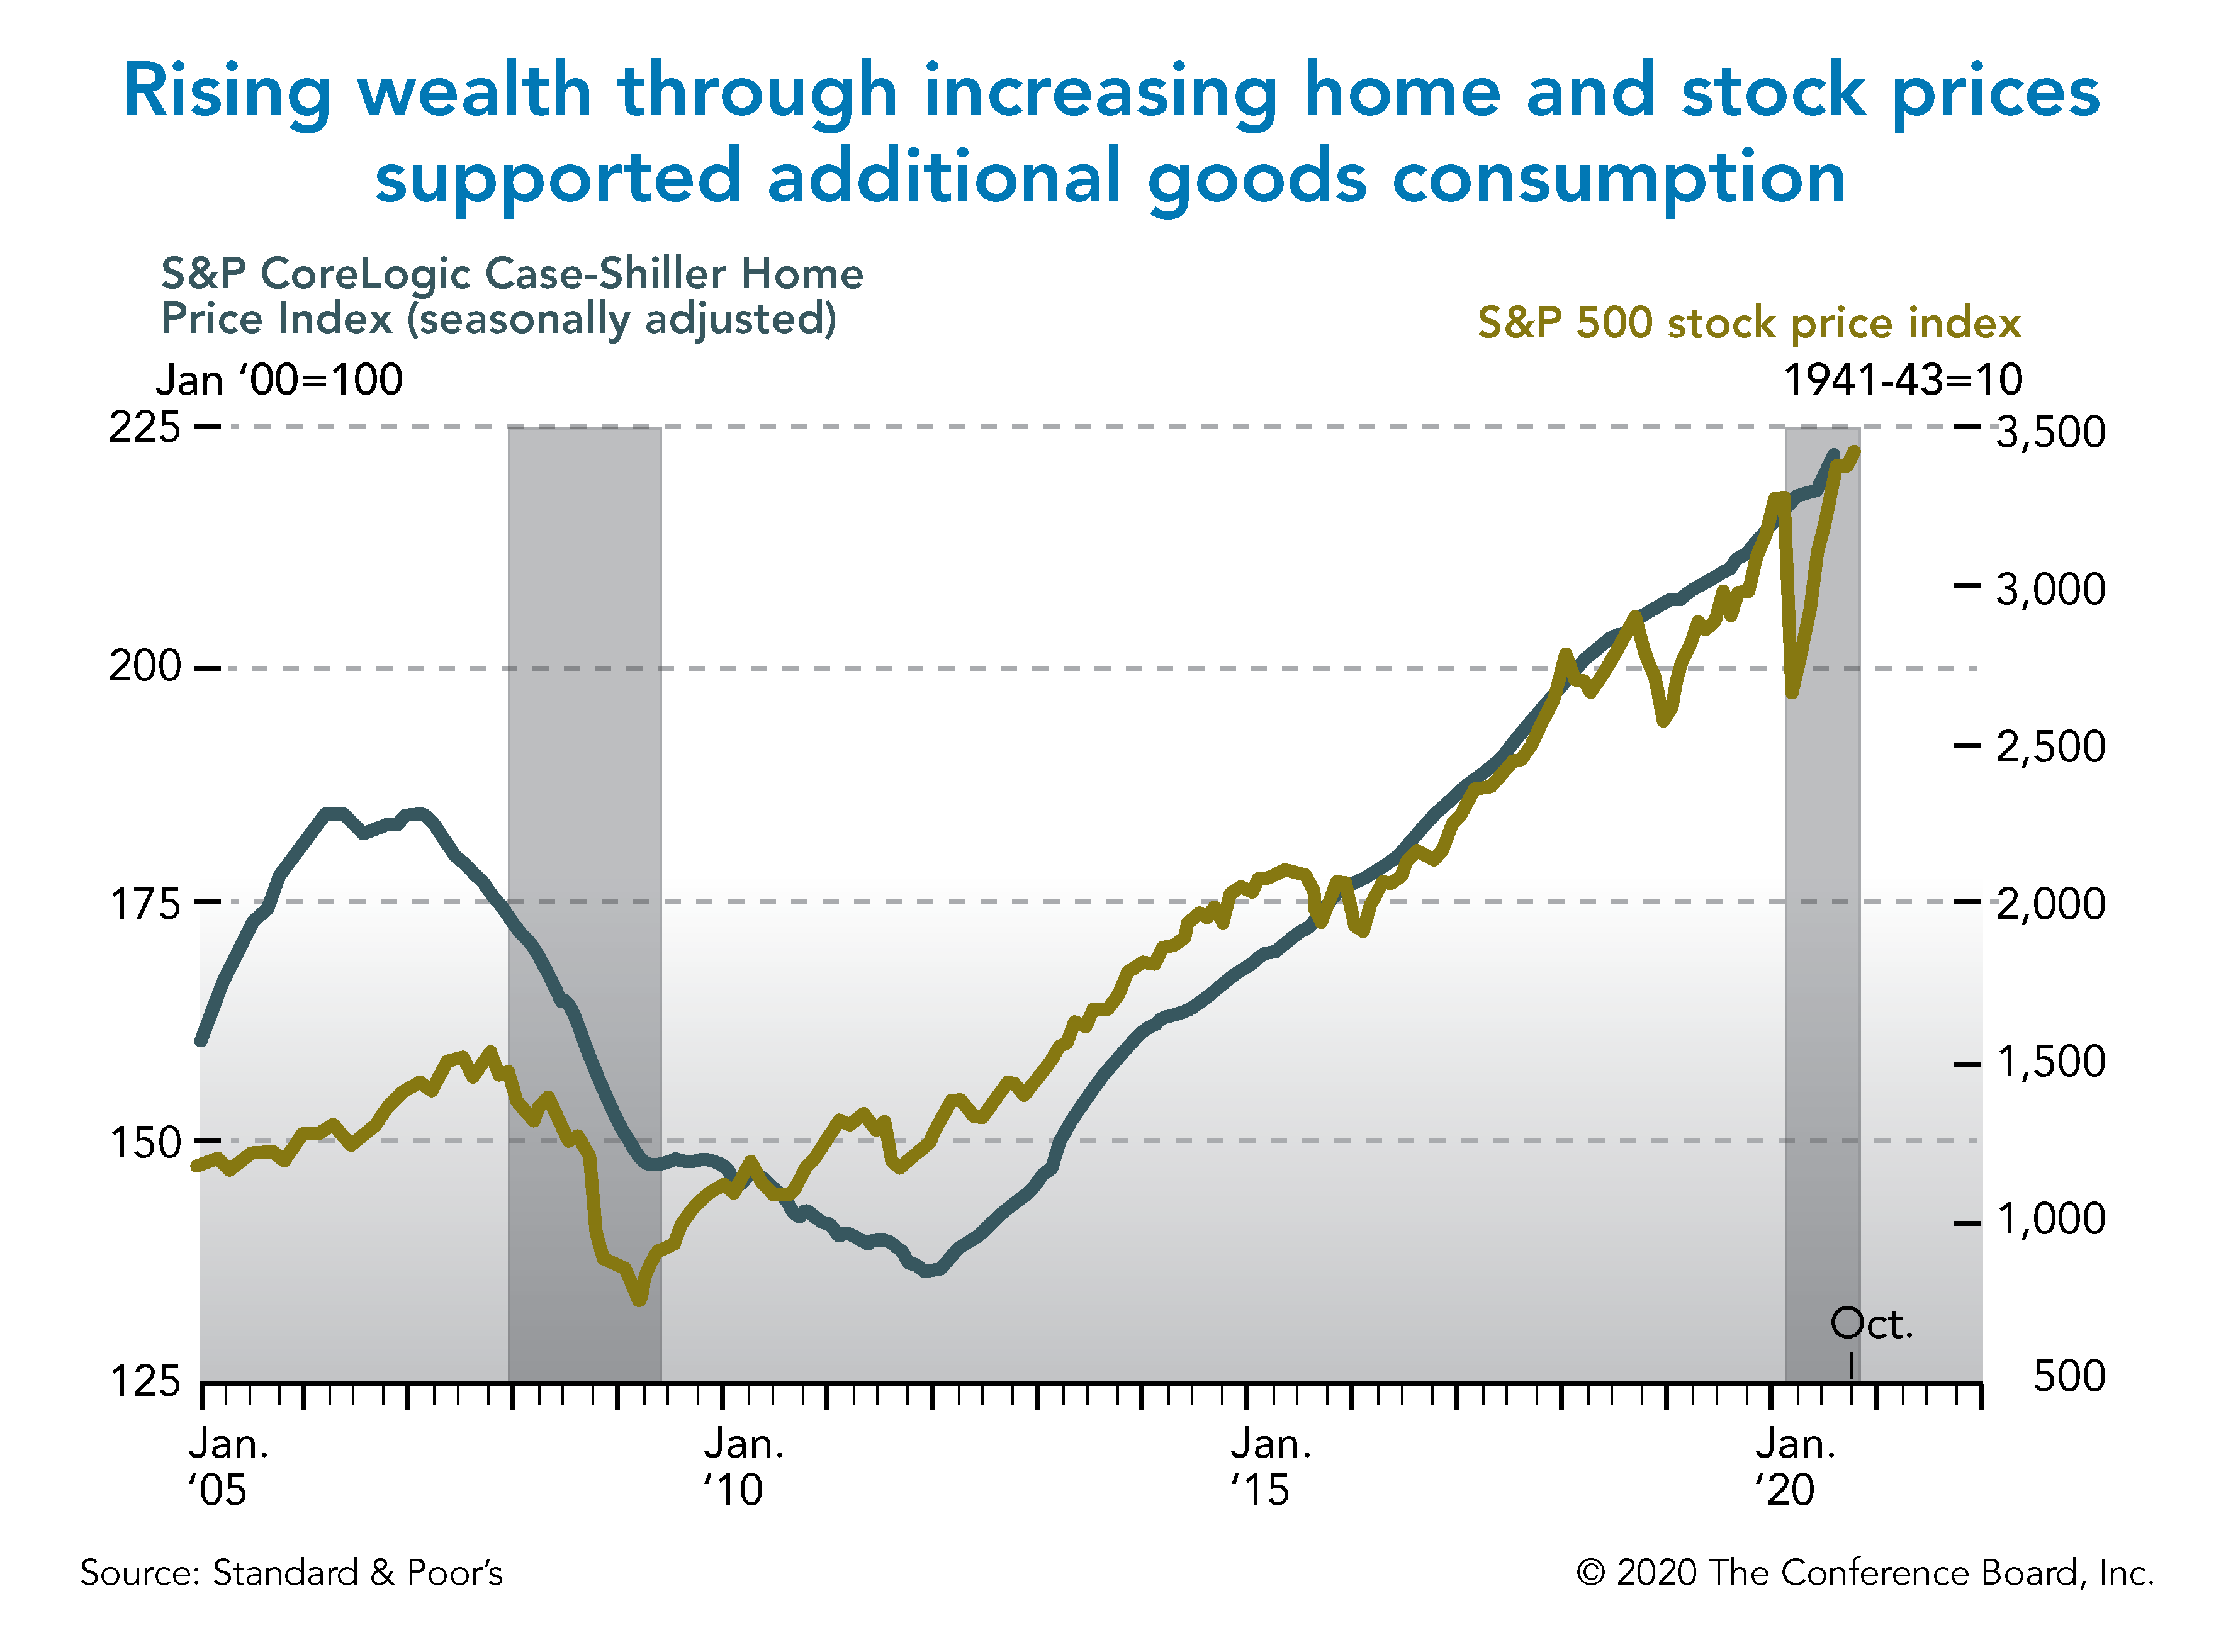
The wealth effect People tend to spend less if the value of their assets drops, even if their income does not change. This is likely because they feel less financially secure and less financially prepared for retirement if the value of their homes or investment portfolios declines. The positive change in asset prices is benefiting households with a significant number of assets. Most households at the lower end of the income distribution have few assets and are therefore much less affected by asset prices. In the financial crisis of 2008–09, the large drop in home and stock prices significantly lowered household wealth in the US.
One of the unique features of this recession is that most measures of stock prices are up year-to-date despite the recession, as a result of historically low interest rates and strong perceived potential for technology companies. In addition, the pandemic did not seem to have a negative impact on the trajectory of home prices, which kept rising. Overall, the wealth effect appears to be playing a supportive role in dampening the effects of this recession for a segment of the population, primarily for homeowners and higher-income households that hold a larger share of their total value of assets in stocks.
Meanwhile, the labor force participation of the 65+ age group seems to have significantly dropped during COVID-19, after more than 20 years of continuous increase. In this recession, retirement preparedness was not significantly harmed by drops in home and stock prices as in the Great Recession of 2008–09. Unlike then, the pandemic-induced recession has not spurred delayed retirements. On the contrary, the COVID-19 risk for older people may have led some to early retirements because of concerns about getting infected.
Chart 5
Booming housing activity Typically in recessions, construction and sales of housing units significantly drop, leading to a decline in spending on housing-related categories such as appliances and furniture. In the pandemic-induced recession, housing indicators such as building permits and new and existing home sales are already at or above prepandemic levels. The elevated levels mostly reflect record low mortgage rates; pent-up demand, especially among potential home buyers who did not experience layoffs; and flight from cities to suburbs, exurbs, and rural areas. The strength in construction of new housing and high churning of existing housing support strong consumption of housing-related goods such as furniture and building materials.
Economic implications for employers and workers
- Services tend to be very labor intensive; hence, the drop in spending among services industries led to large job losses. Job losses in vacation destinations were especially acute, particularly given domestic and international travel bans, and the inability of consumers to effectively socially distance themselves while engaging in leisure activities.
- As a result of the shift to spending on goods, economic activity and employment growth are better than average in industries related to the production, import, transportation, storage, and selling of goods. For example, production of durable consumer goods is essentially back to prepandemic levels, and imports of consumer goods are above prepandemic levels. The swell in goods consumption has benefited manufacturers and importers of manufactured products, who are typically very hard hit during recessions.
- Employment in brick-and-mortar retail is an exception, as many retail outlets experienced a large employment drop associated with an accelerated shift toward online shopping.
- The outsized spending on goods and the accelerated shift to online shopping boosted revenues for the freight transportation, home delivery, and warehousing industries.
The outlook for US consumer spending recovery
The outlook for consumer spending crucially depends on the health risk from COVID-19. As long as the health risk is perceived to be high, the recovery in US consumer spending is likely to remain challenged.
Over the next three months, new government restrictions will be enforced. Restrictions may depend on the transmission rate. How severe must restrictions be to keep the virus contained? The answer will vary by location and age. More severe social distancing will probably be needed in densely populated areas that rely on public transportation, and for older people and those with existing health issues.
Economic activity going forward will depend in large part on what governments decide in terms of restrictions and the level of fear of contracting the virus among consumers. For example, governments are keeping airlines open, but many consumers fear flying (see Chart 6). Spending on services categories will not go back to normal until the risk of getting infected is minimal, even as the US attempts to balance two goals: a healthy population and a healthy economy.
Chart 6
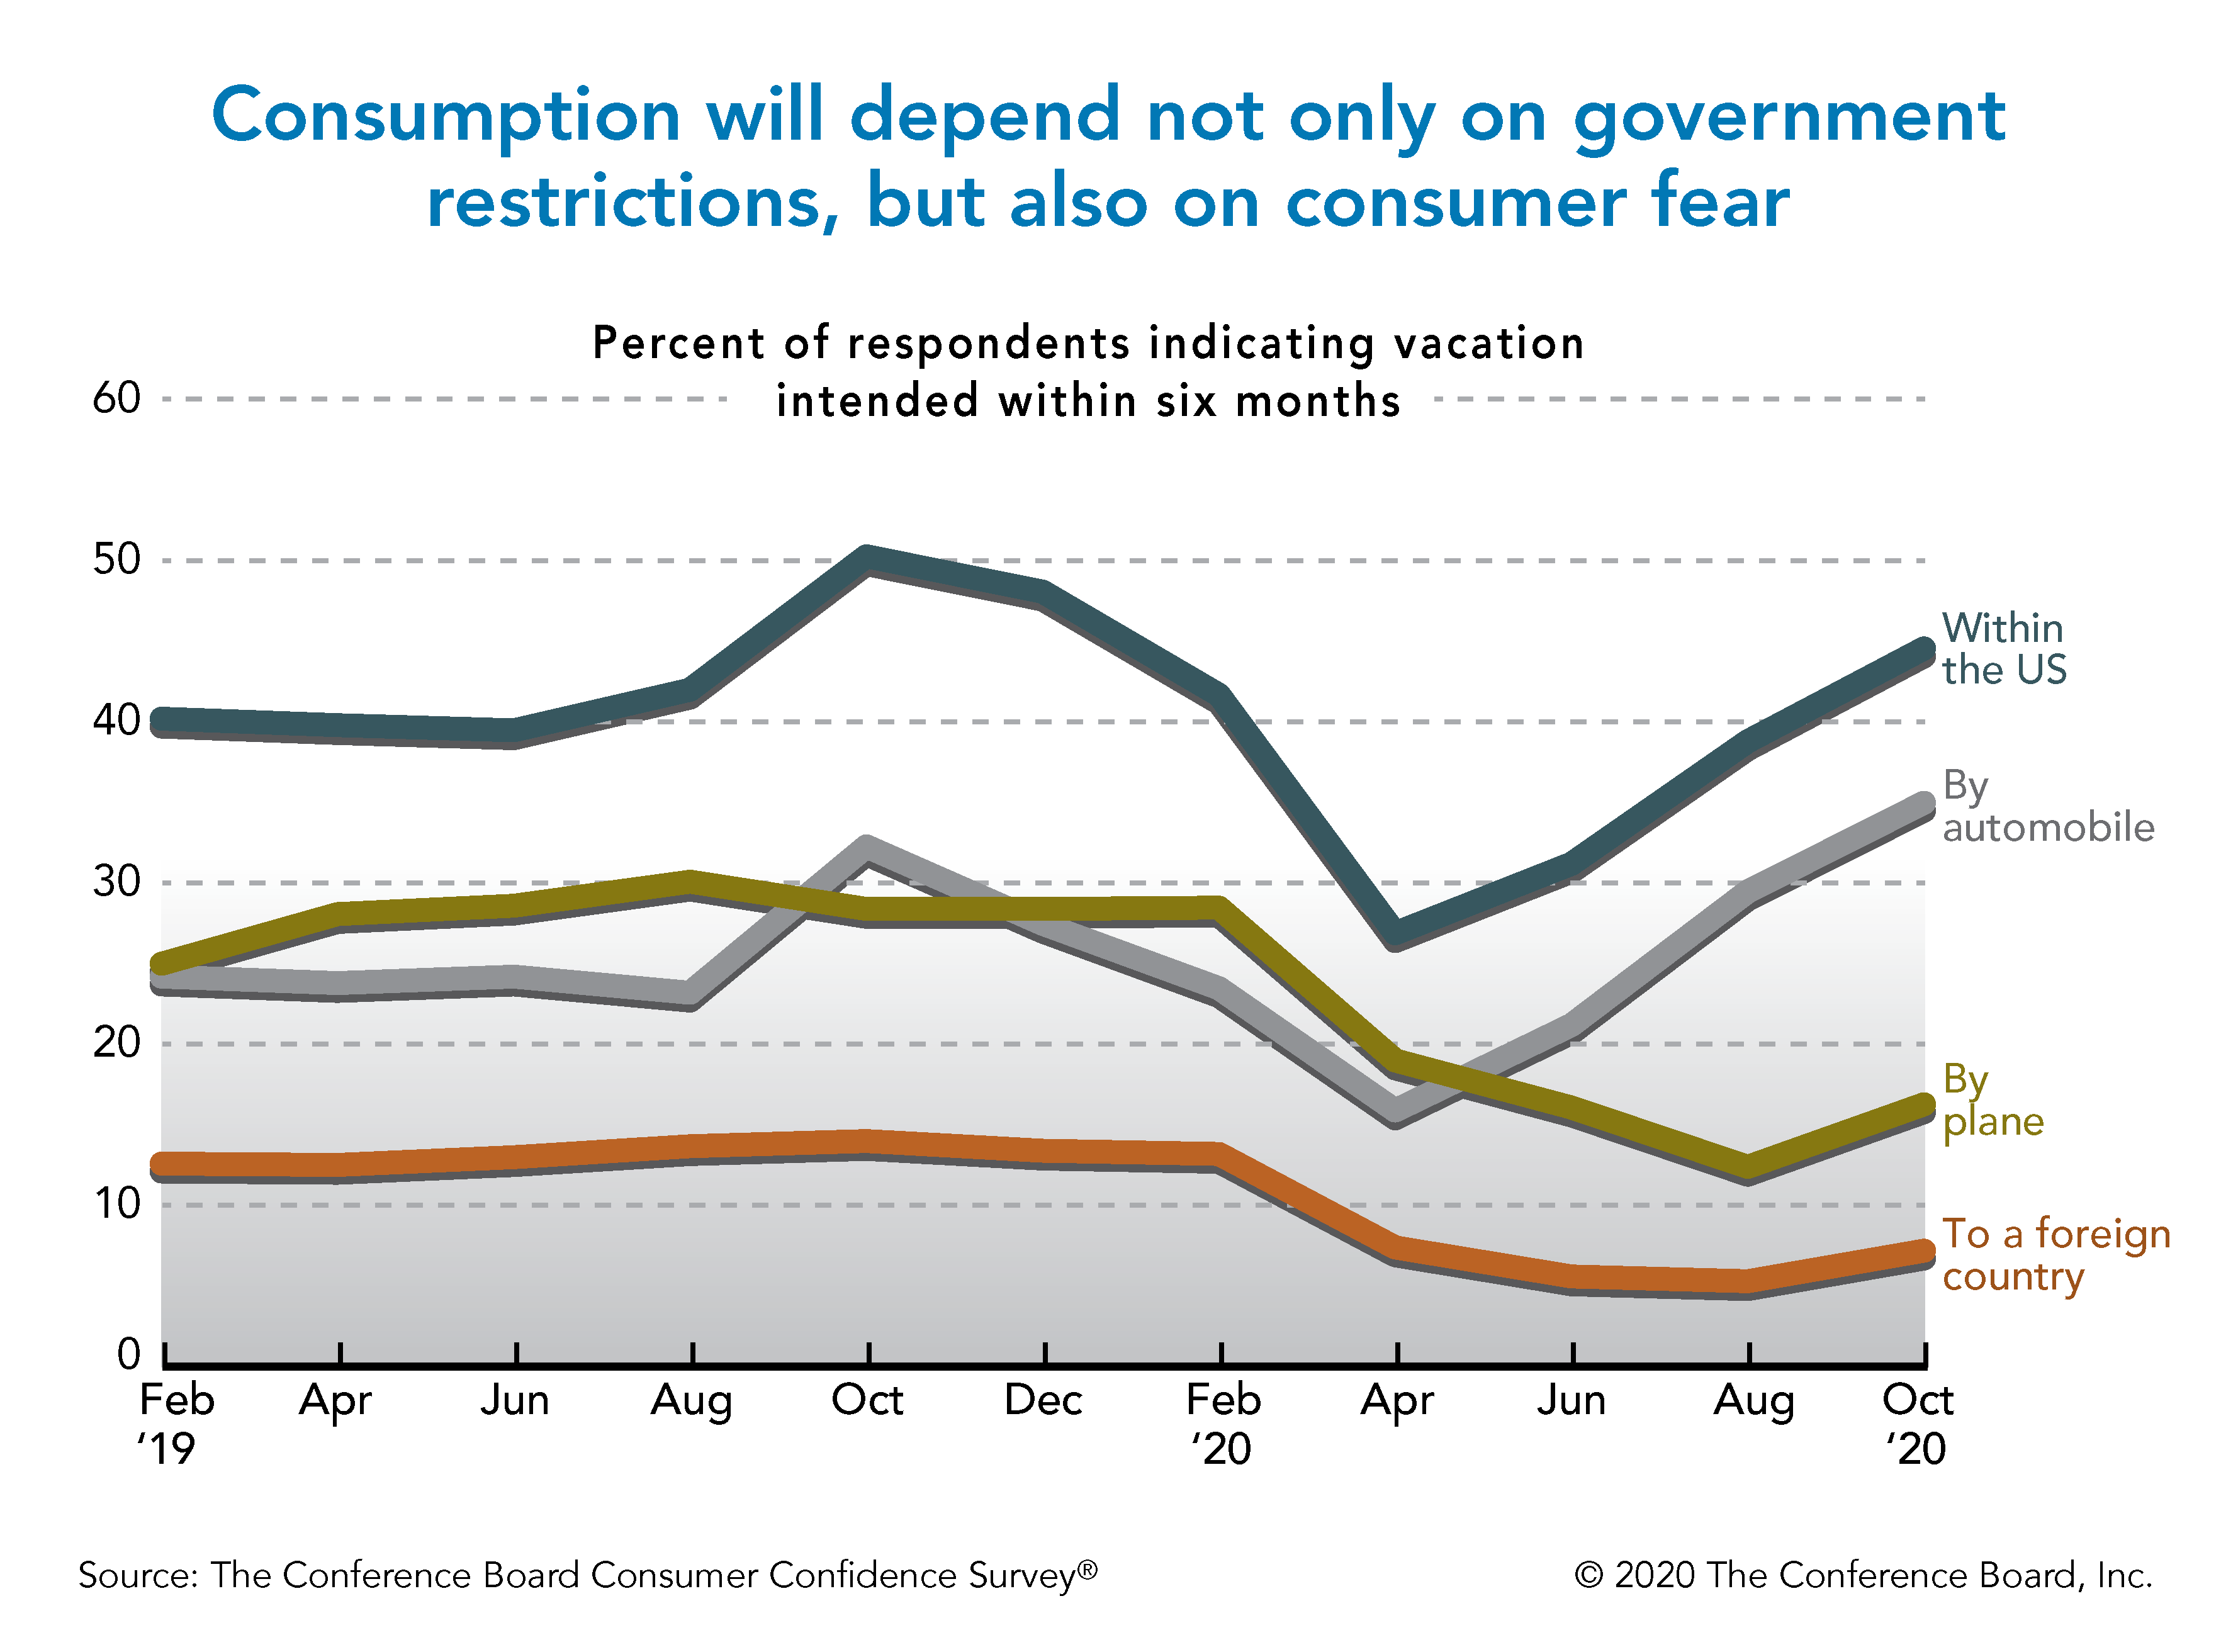
As COVID-19 poses a higher risk for older adults, this population is more likely to stay at home and avoid visitors. Consequently, the recovery in services spending among older Americans is likely to lag that of younger consumers. In particular, older consumers tend to disproportionally spend on travel, lodging, full-service restaurants, and repair and maintenance.
In the next three months, employment growth will significantly slow down, or even turn negative, and future government stimulus is questionable. As a result, the recovery in consumer spending may significantly slow down in the coming months.
The outlook for 2021 depends on the speed at which reliable vaccines and/or medical treatments are produced and distributed to the majority of the population. That is likely to be accomplished in 2021 and lead to a meaningful economic recovery. In such a scenario, consumer spending may rapidly grow in 2021.

