


Loading...
16 July 2026 / Report
The US economy entered H2 2026 with a more uneven growth profile. The transition toward investment-led growth represents one of the defining characteristics of the current expansion. Throughout the post-pandemic recovery, household consumption accounted for the majority of economic growth. Today, that leadership is gradually shifting toward businesses investing in productivity-enhancing technologies. At the macro level, productivity gains from AI are apparent in GDP and in productivity defined by non-farm business output divided by aggregate hours worked. However, for companies and workers, the magnitude of the productivity gains generated by this investment remains uncertain. Still, the growth transition should allow the economy to continue expanding despite softer consumer spending, although the resulting growth profile is likely to remain uneven across industries.U.S. Outlook: Investment Takes the Baton from Consumers
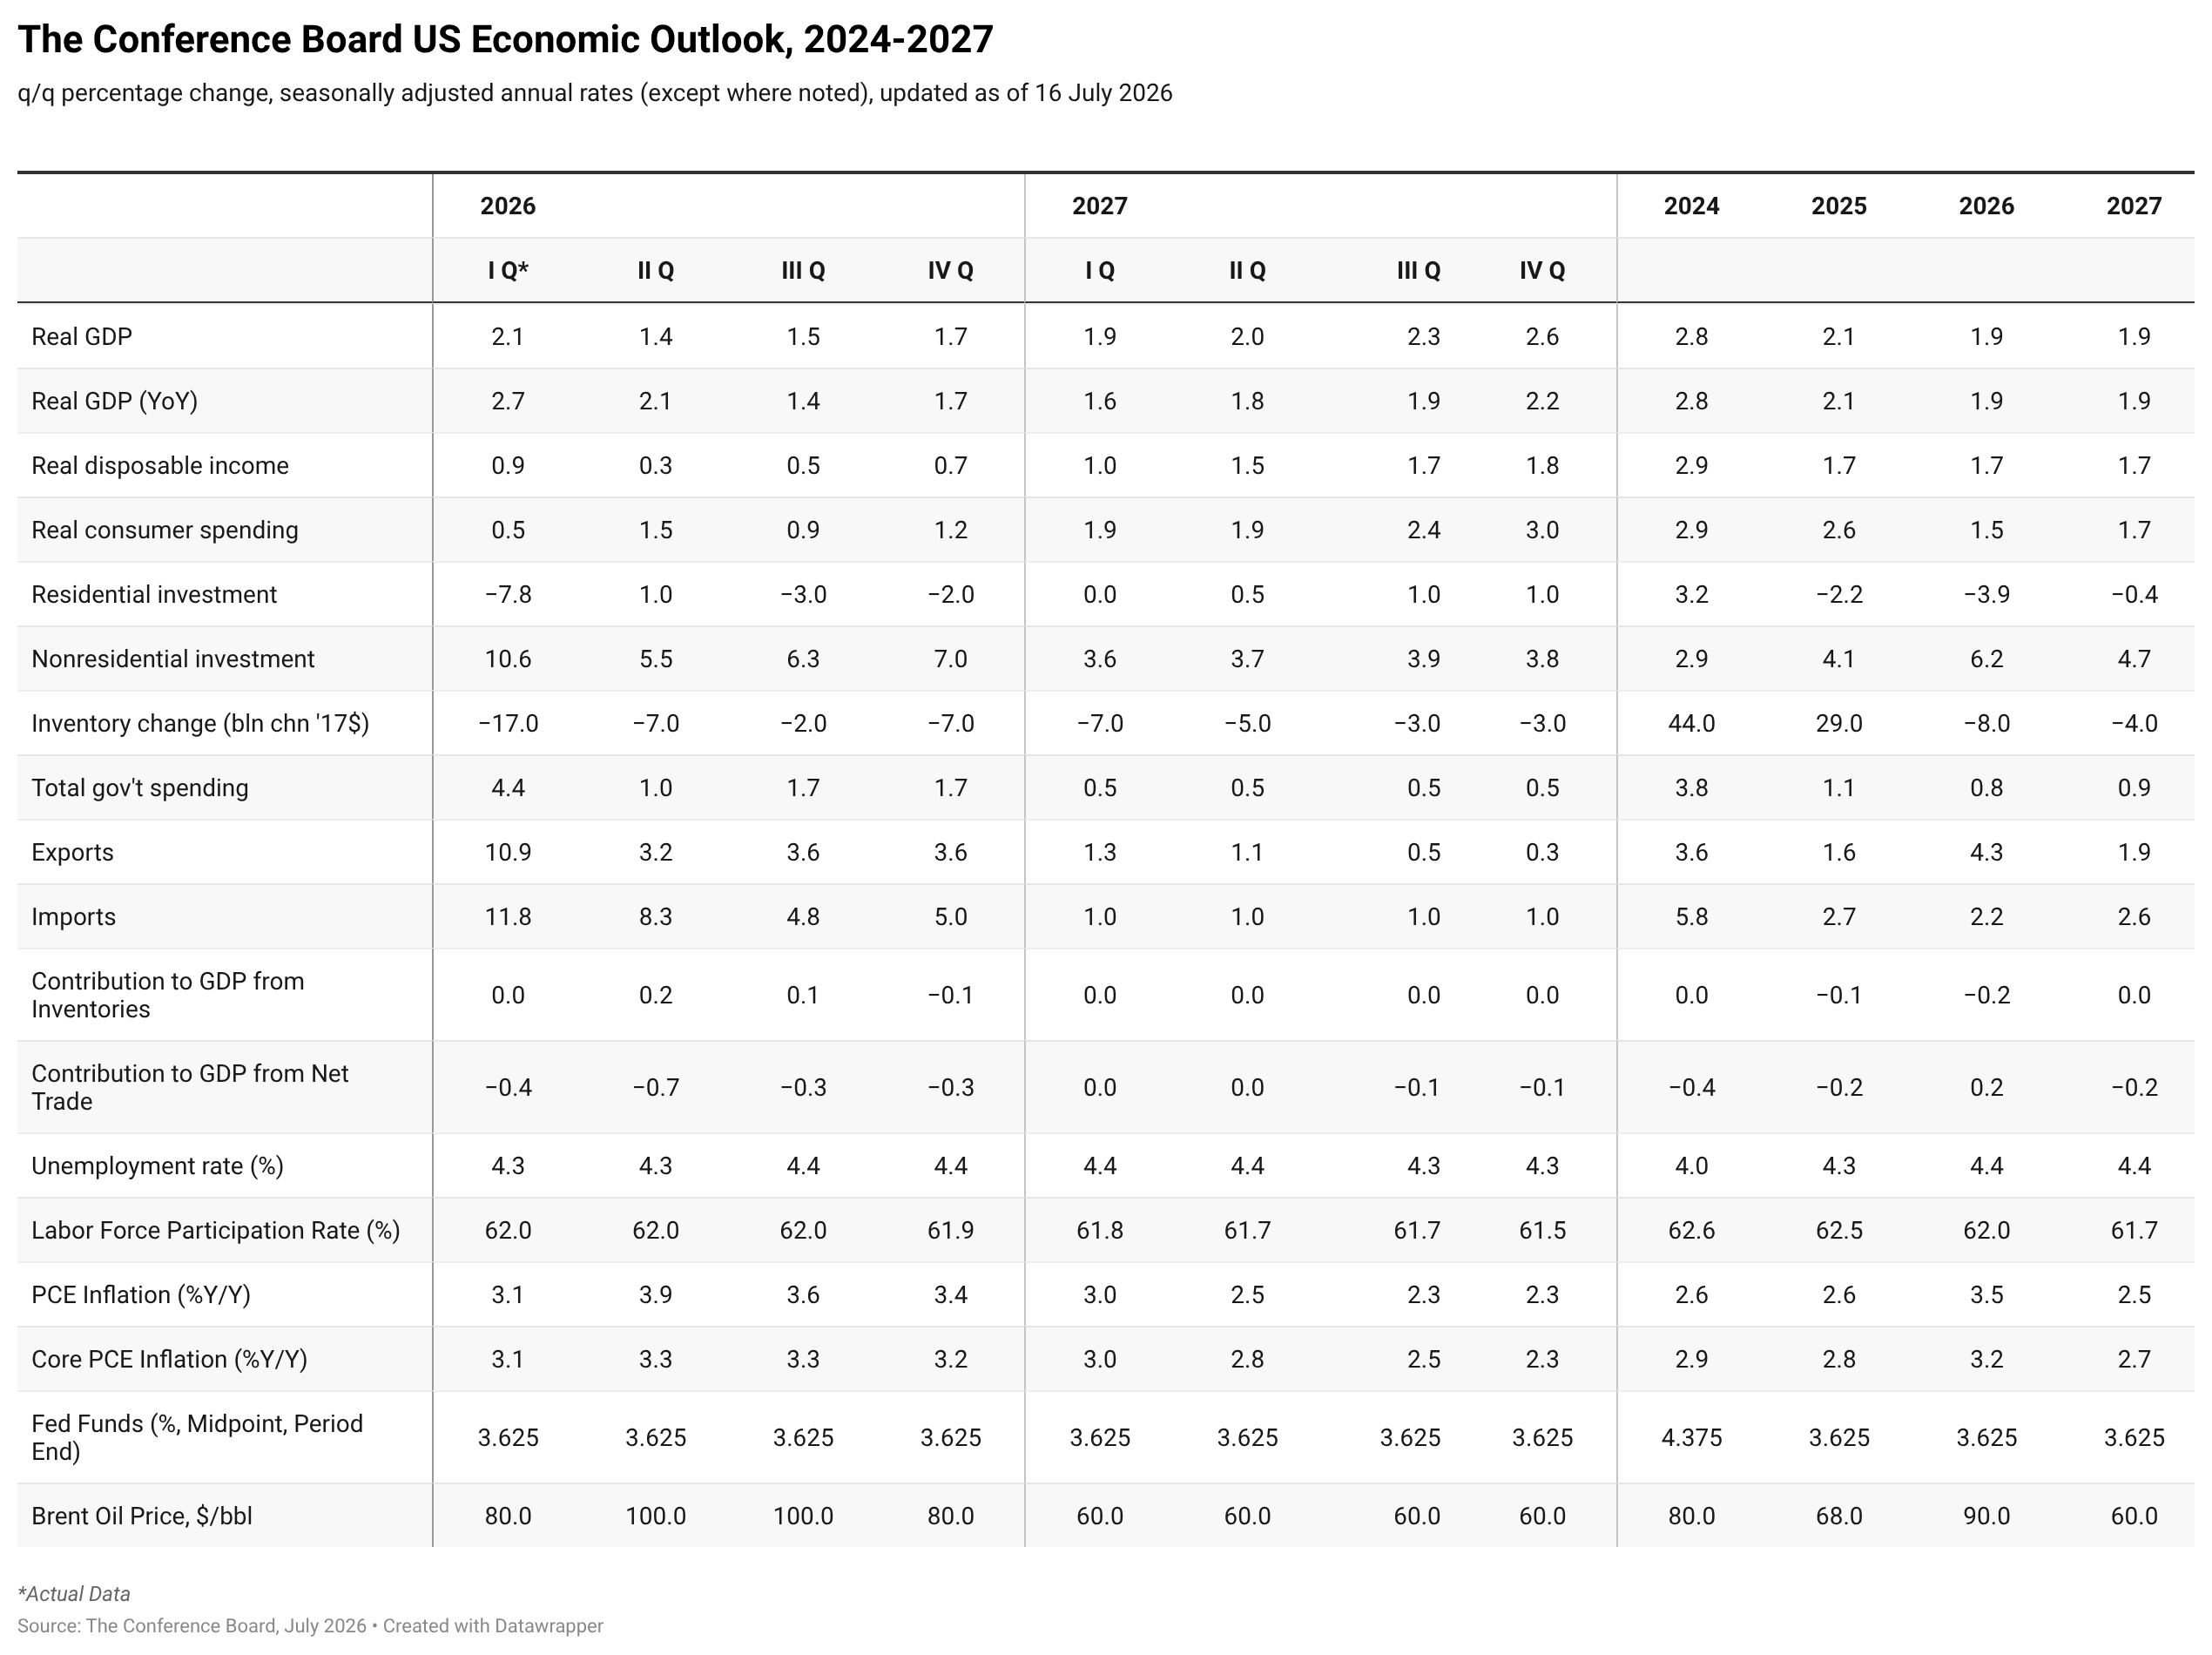
Inflation has moderated as the temporary surge in energy prices associated with the Middle East conflict has largely reversed. With hostilities resuming in the Middle East, the risk is that both overall and underlying inflation could rise.
Inflation has improved, but affordability has not. Consumers continue to face substantially higher living costs than prior to the pandemic due to elevated prices. Housing expenses remain high, homeowner insurance premiums continue to rise rapidly in many parts of the country, financing costs remain restrictive, and cumulative inflation has permanently raised the cost of many essential goods and services. Although nominal wage growth remains positive, purchasing power remains limited by elevated prices.
The labor market continues to provide an important source of stability. While unemployment remains historically low, job creation has become increasingly concentrated among a relatively small number of industries. The growing concent
myTCB® Members get exclusive access to webcasts, publications, data and analysis, plus discounts to events.

Charts
The Gray Swans Tool helps C-suite executives better navigate today’s quickly developing economic, political, and technological environments.
LEARN MORECharts
Preliminary PMI indices show no change in weak DM growth momentum in November
LEARN MORE
Charts
How Might the World Fall Back into Recession?
LEARN MORECharts
Passing increases downstream, cutting costs, and absorbing price increases into profit margins are the chief ways to manage rising input costs. Few see changing
LEARN MORECharts
US continues to lead global productivity race
LEARN MORECharts
The Global Economic Fallout of the Ukraine Invasion
LEARN MORECharts
The global supply chain disruption associated with the COVID-19 pandemic has resulted in production delays, shortages, and a spike in inflation in world.
LEARN MORECharts
The Conference Board recently released its updated 2022 Global Economic Outlook.
LEARN MORE

Connect and be informed about this topic through webcasts, virtual events and conferences
PRESS RELEASE
The LEI for the Euro Area fell in June
July 17, 2026
PRESS RELEASE
LEI for Mexico Declined in June
July 17, 2026
PRESS RELEASE
The LEI for France Increased in May
July 16, 2026
PRESS RELEASE
LEI for Brazil increased in June
July 15, 2026
PRESS RELEASE
The LEI for the UK fell again in May
July 14, 2026
PRESS RELEASE
LEI for Australia Increased in May
July 14, 2026
All release times displayed are Eastern Time
This report identifies trends to help businesses prepare for an environment with more challenges for labor and capital but improvements in productivity growth.
LEARN MOREConnect and be informed about this topic through webcasts, virtual events and conferences
July 16, 2026 | Report
The Conference Board Economic Forecast for the US Economy
July 16, 2026 | Report
June Retail Sales Boosted by Early Prime Day and World Cup
July 16, 2026 | Brief
June CPI Closes the Door for July Rate Hike
July 14, 2026 | Brief
Volatility Notwithstanding, Labor Market Signals a Fed on Hold
July 02, 2026 | Brief
May Spending Rebounds, but Inflation Takes Its Toll
June 25, 2026 | Brief

USMCA 2.0—Trade Uncertainty in North America
June 10, 2026
Power Shifts: From the Fed to EV Markets
May 13, 2026
The Iran Conflict: Risks for the Global Economy
April 15, 2026
Priced Out: The State of US Housing Affordability
February 11, 2026
The CEO Outlook for 2026—Uncertainty, Risks, Growth & Strategy
January 15, 2026
The Big Picture: What's Ahead for the Global Economy?
December 10, 2025
