Press Release
Employment Trends Index™ (ETI) Increased in January
2024-02-05
Index Points to Continued Job Growth in the Coming Months
Access Current & Historical Data
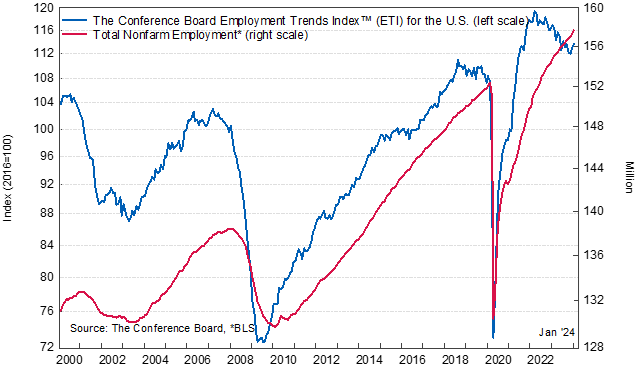
The Conference Board Employment Trends Index™ (ETI) increased in January to 113.71, up from a downwardly revised 112.91 in December. The Employment Trends Index is a leading composite index for employment. When the Index increases, employment is likely to grow as well, and vice versa. Turning points in the Index indicate that a change in the trend of job gains or losses is about to occur in the coming months.
“The ETI increased for a second consecutive month, suggesting employment growth will continue in the coming months,” said Selcuk Eren, Senior Economist at The Conference Board. “The Index now stands at its highest level since May 2023 and remains elevated compared to prepandemic levels, though below its peak in March 2022.”
Eren added: “Payroll gains were economywide in January 2024, after being predominantly driven by three industries (healthcare and social assistance, leisure and hospitality, government) in the second half of 2023. Temporary help services—an early indicator for hiring in other industries and a component of the ETI—added jobs in January, breaking the downward trend observed since April 2022. Furthermore, the percentage of consumers saying jobs were ‘hard to get’ in The Conference Board Consumer Confidence Survey®—another ETI component—is back to single digits for the first time since March 2022. With job openings remaining elevated compared to prepandemic levels and layoffs at an historic low, the prospects of a soft landing continue to rise."
January’s increase in the Employment Trends Index was driven by positive contributions from four of its eight components: Percentage of Respondents Who Say They Find “Jobs Hard to Get,” Real Manufacturing and Trade Sales, Number of Employees Hired by the Temporary-Help Industry, and Initial Claims for Unemployment Insurance.
The Employment Trends Index aggregates eight leading indicators of employment, each of which has proven accurate in its own area. Aggregating individual indicators into a composite index filters out “noise” to show underlying trends more clearly.
The Conference Board Employment Trends Index™, January 2000 to Present
The eight leading indicators of employment aggregated into the Employment Trends Index include:
- Percentage of Respondents Who Say They Find “Jobs Hard to Get” (The Conference Board Consumer Confidence Survey®)
- Initial Claims for Unemployment Insurance (U.S. Department of Labor)
- Percentage of Firms with Positions Not Able to Fill Right Now (© National Federation of Independent Business Research Foundation)
- Number of Employees Hired by the Temporary-Help Industry (U.S. Bureau of Labor Statistics)
- Ratio of Involuntarily Part-time to All Part-time Workers (BLS)
- Job Openings (BLS)*
- Industrial Production (Federal Reserve Board)*
- Real Manufacturing and Trade Sales (U.S. Bureau of Economic Analysis)**
*Statistical imputation for the recent month
**Statistical imputation for two most recent months
The Conference Board publishes the Employment Trends Index monthly, at 10 a.m. ET, on the Monday that follows each Friday release of the Bureau of Labor Statistics Employment Situation report. The technical notes to this series are available on The Conference Board website: http://www.conference-board.org/data/eti.cfm.
NOTE: This month’s release incorporates annual revisions of standardization factors to the Employment Trends Index, which bring it up-to-date with revisions in the source data. These revisions do not change the cyclical properties of the index. The standardization factors, known as volatility adjustment factors, are done by calculating the standard deviation of the monthly percent change in each component. The updated period used for calculating the standardization factors is November 1973 to December 2022. The standardization factors are then used to construct the index from November 1973 to present. As a result, the revised index, in levels and month-on-month changes, will not be directly comparable to those issued prior to this annual revision. For more information, please visit our website at http://www.conference-board.org/data/eti.cfm
|
Employment Trends Index (ETI)™ 2024 Publication Schedule |
|
|
Index Release Date (10 AM ET) |
Data for the Month |
|
Monday, January 8, 2024 |
December 2023 |
|
Monday, February 5 |
January 2024 |
|
Monday, March 11 |
February |
|
Monday, April 8 |
March |
|
Monday, May 6 |
April |
|
Monday, June 10 |
May |
|
Monday, July 8 |
June |
|
Monday, August 5 |
July |
|
Monday, September 9 |
August |
|
Monday, October 7 |
September |
|
Monday, November 4 |
October |
|
Monday, December 9 |
November |
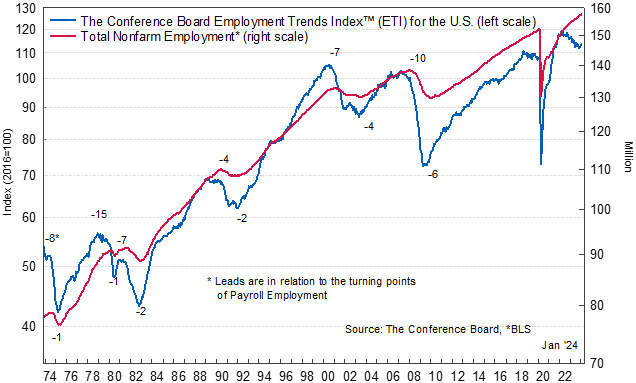
The Conference Board Employment Trends Index™ and Turning Points, November 1973 to Present
For further information contact:
Joseph DiBlasi
781.308.7935
JDiBlasi@tcb.org


.png)