


.png)
.png)


Loading...
September 23, 2022 | Report
![]()


Business cycles are recurrent sequences of economic activity that occur in market economies. They consist of alternating waves of expansion and contraction that are observed across many different sectors in an economy at about the same time. While expansions are characterized by increasing economic activity in output, income, sales, and employment, recessions are defined by across-the-board decreases in the levels of economic activity. Business cycle phases of expansion and contraction tend to be asymmetrical, meaning recessions are short interruptions of expansion periods of long and sustained growth.
Although the sequences of economic activity are not identical in every recession or expansion, they do share common elements that tend to recur in the history of economies, suggesting that monitoring and predicting these movements will be useful in economic and policy decisions. Indeed, there is much enthusiasm for the study of business cycles around the world, from businesses to international organizations like the OECD to national central banks and statistical agencies.
Identifying peaks and troughs in business cycles helps to describe the dynamics of an economy over time. Economic indicators are further classified by their cyclical timing. Those that move in tandem with the business cycle are called coincident. Those that move ahead of the cycle are called leading.
Recurrent fluctuations in market economies were first observed in the 19th and early 20th centuries. Although economic statistics were not well developed then, many metrics were collected and published over time, such as coal and steel production. These metrics were eventually catalogued by economists at the National Bureau of Economic Research (NBER), a US nonprofit organization founded in 1920 by Wesley C. Mitchell. Under the leadership of Mitchell and Arthur Burns, NBER developed a formal standardized approach to describing and measuring business cycles based on observed economic statistics (see Wesley C. Mitchell and Arthur F. Burns: Statistical Indicators of Cyclical Revivals, NBER, 1938, and Measuring Business Cycles, NBER, 1946). Their work defined business cycles and later led to the development of business cycle indicators for the US and many other economies around the world.
|
“Business cycles are a type of fluctuation found in the aggregate economic activity of nations that organize their work mainly in business enterprises: a cycle consists of expansions occurring at about the same time in many economic activities, followed by similarly general recessions, contractions, and revivals which merge into the expansion phase of the next cycle; this sequence of changes is recurrent but not periodic; in duration business cycles vary from more than one year to ten or twelve years; they are not divisible into shorter cycles of similar character with amplitudes approximating their own.” —Wesley C. Mitchell, Business Cycles: The Problem and Its Setting, NBER, 1927. |
The economy goes through recurrent ups and downs delineated by peaks and troughs
Leading indicators move ahead of the peaks and troughs in the overall business cycle
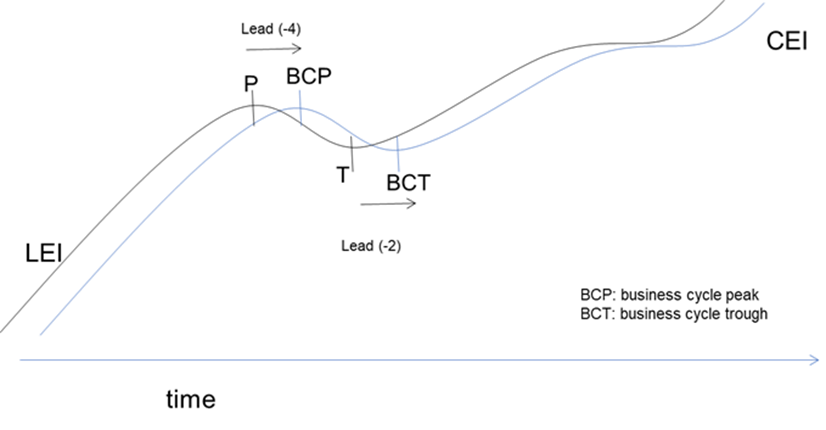
Source: The Conference Board, 2022
The business cycle describes an economy fluctuating around a long-term trend
Removing the long-term trend (right panel) reveals growth cycles
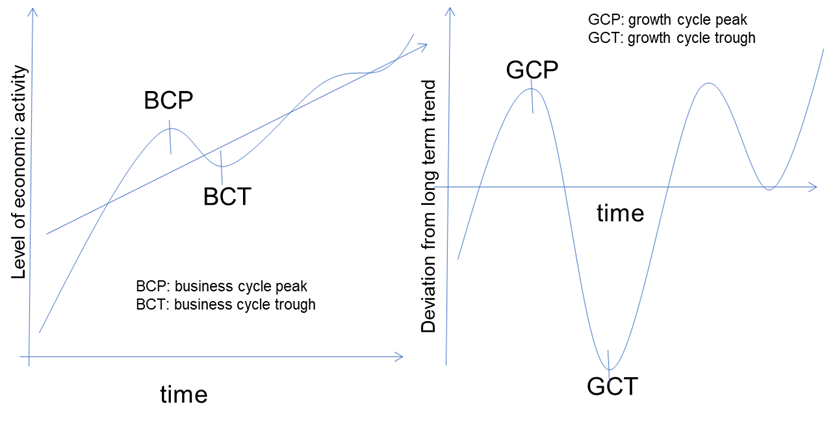
Source: The Conference Board, 2022
A series of alternating peaks and troughs (business cycle turning points) is often referred to as a business cycle chronology. NBER’s Business Cycle Dating Committee is the keeper of these chronologies in the US. When the series refers to the whole economy, it could be called a reference cycle for the given economy. The Bry-Boschan algorithm (Gerhard Bry and Charlotte Boschan, Cyclical Analysis of Time Series: Selected Procedures and Computer Programs, NBER, 1971) is often used to determine business cycle turning points more precisely than can be done by visual inspection of individual data sets.
The programmed algorithm replicates the NBER Business Cycle Dating Committee’s decisions for the US economy. It has helped organizations like The Conference Board develop series of business cycle chronologies for economic variables and for entire economies.
The Bry-Boschan algorithm applies a systematic approach to identify local minima and maxima in the data series being studied. These are then filtered according to a series of parameters or rules. For example:
There are exceptions to these rules, as exemplified by the 2020 recession, which lasted only two months due to the lockdowns required by the global pandemic.
The coincident index is the cornerstone of the indicator approach The Conference Board employs. It provides a broad measure of aggregate monthly economic activity, helping define expansion and contraction periods. Combining the indicators that best define the business cycle—such as employment, production, income, and sales—into a coincident index provides a framework that emphasizes common patterns and deemphasizes irregular movements in individual indicators.The coincident index is available much sooner than GDP and related figures in the national accounts; further, the coincident index is the target that the leading index is supposed to forecast.
Coincident indicators are included among the short list of data the NBER Business Cycle Dating Committee uses to determine recession dates in the US. Since no single time series fully qualifies as an ideal cyclical indicator, it is important to analyze groups of indicators to look for consistent patterns.
Because it summarizes output, employment, sales, and personal income, the coincident index also plays a special role in dating business cycle turning points. NBER’s official recession dates for the US economy correspond closely to the turning point dates of the coincident index.
US Recession Chronology and The Conference Board Leading and Coincident Economic Indexes: 1959-present
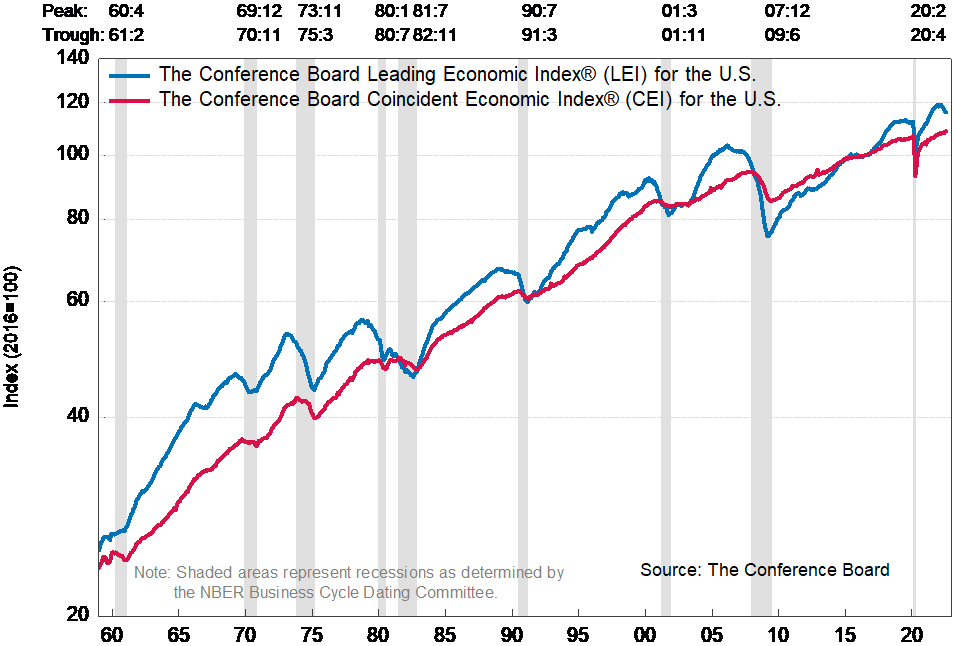
For more information on the most recent iteration of The Conference Board Leading Economic Index®(LEI), please visit our website.
