


.png)
.png)


Loading...
September 14, 2022 | Report
![]()


Even though exact definitions of recession vary across geographies, broadly speaking a recession can be defined as a significant, broad-based decline in the level of economic activity, typically but not exclusively visible in GDP, employment, and/or other measures of economic activity. However, recessions can vary in terms of intensity, length, and which parts of the economy get hit hardest, with some recessions showing only a mild decline in GDP or simply slower growth than the long-term average. The following provides a snapshot of what has happened historically during recessions in the US, Euro Area, and Japan. The recessions that The Conference Board presently forecasts for the US and Euro Area are unique in that they are expected to be relatively mild given the strength of business and household balance sheets and the current strength in labor markets.
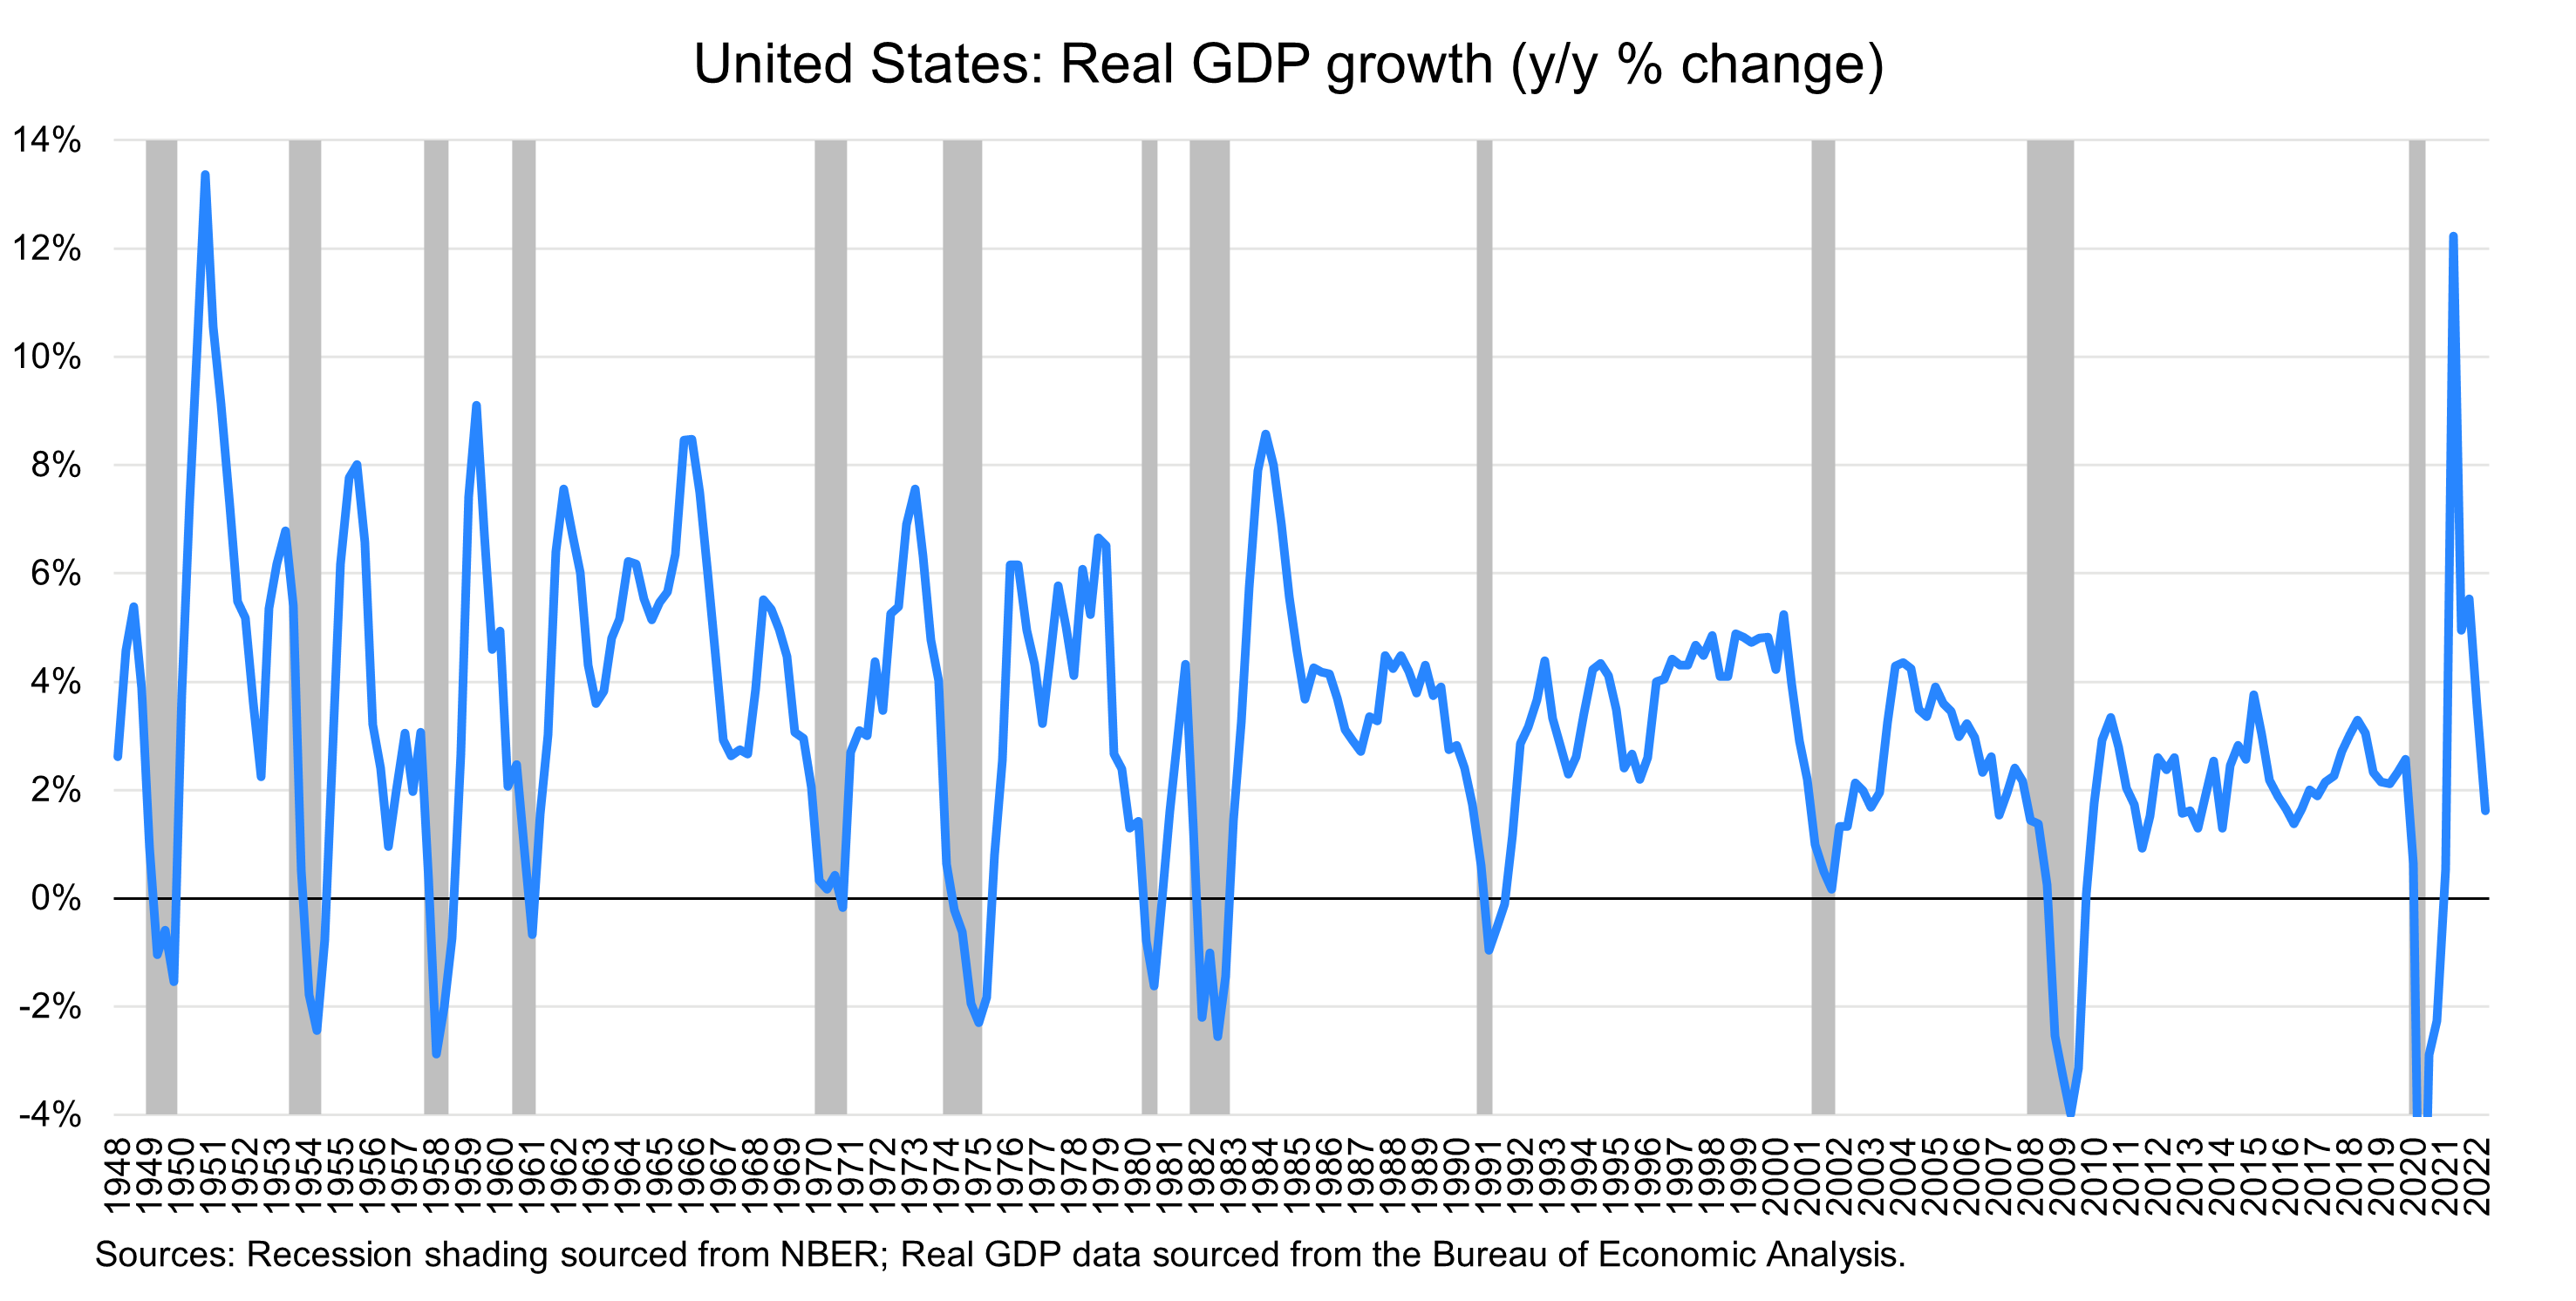
The National Bureau of Economic Research (NBER) counts 13 recessions in the US in the seven decades since the Second World War. The median US recession lasts about 10 months and occurs about every 50 months, but there are outliers: the 1973, 1981, and 2008 recessions lasted 16 months or more, and the pandemic recession lasted only two months.
During recessions, the median real GDP decline is 2.3 percent, with most of the drop explained by reductions in investment and profits, while government spending typically goes up.
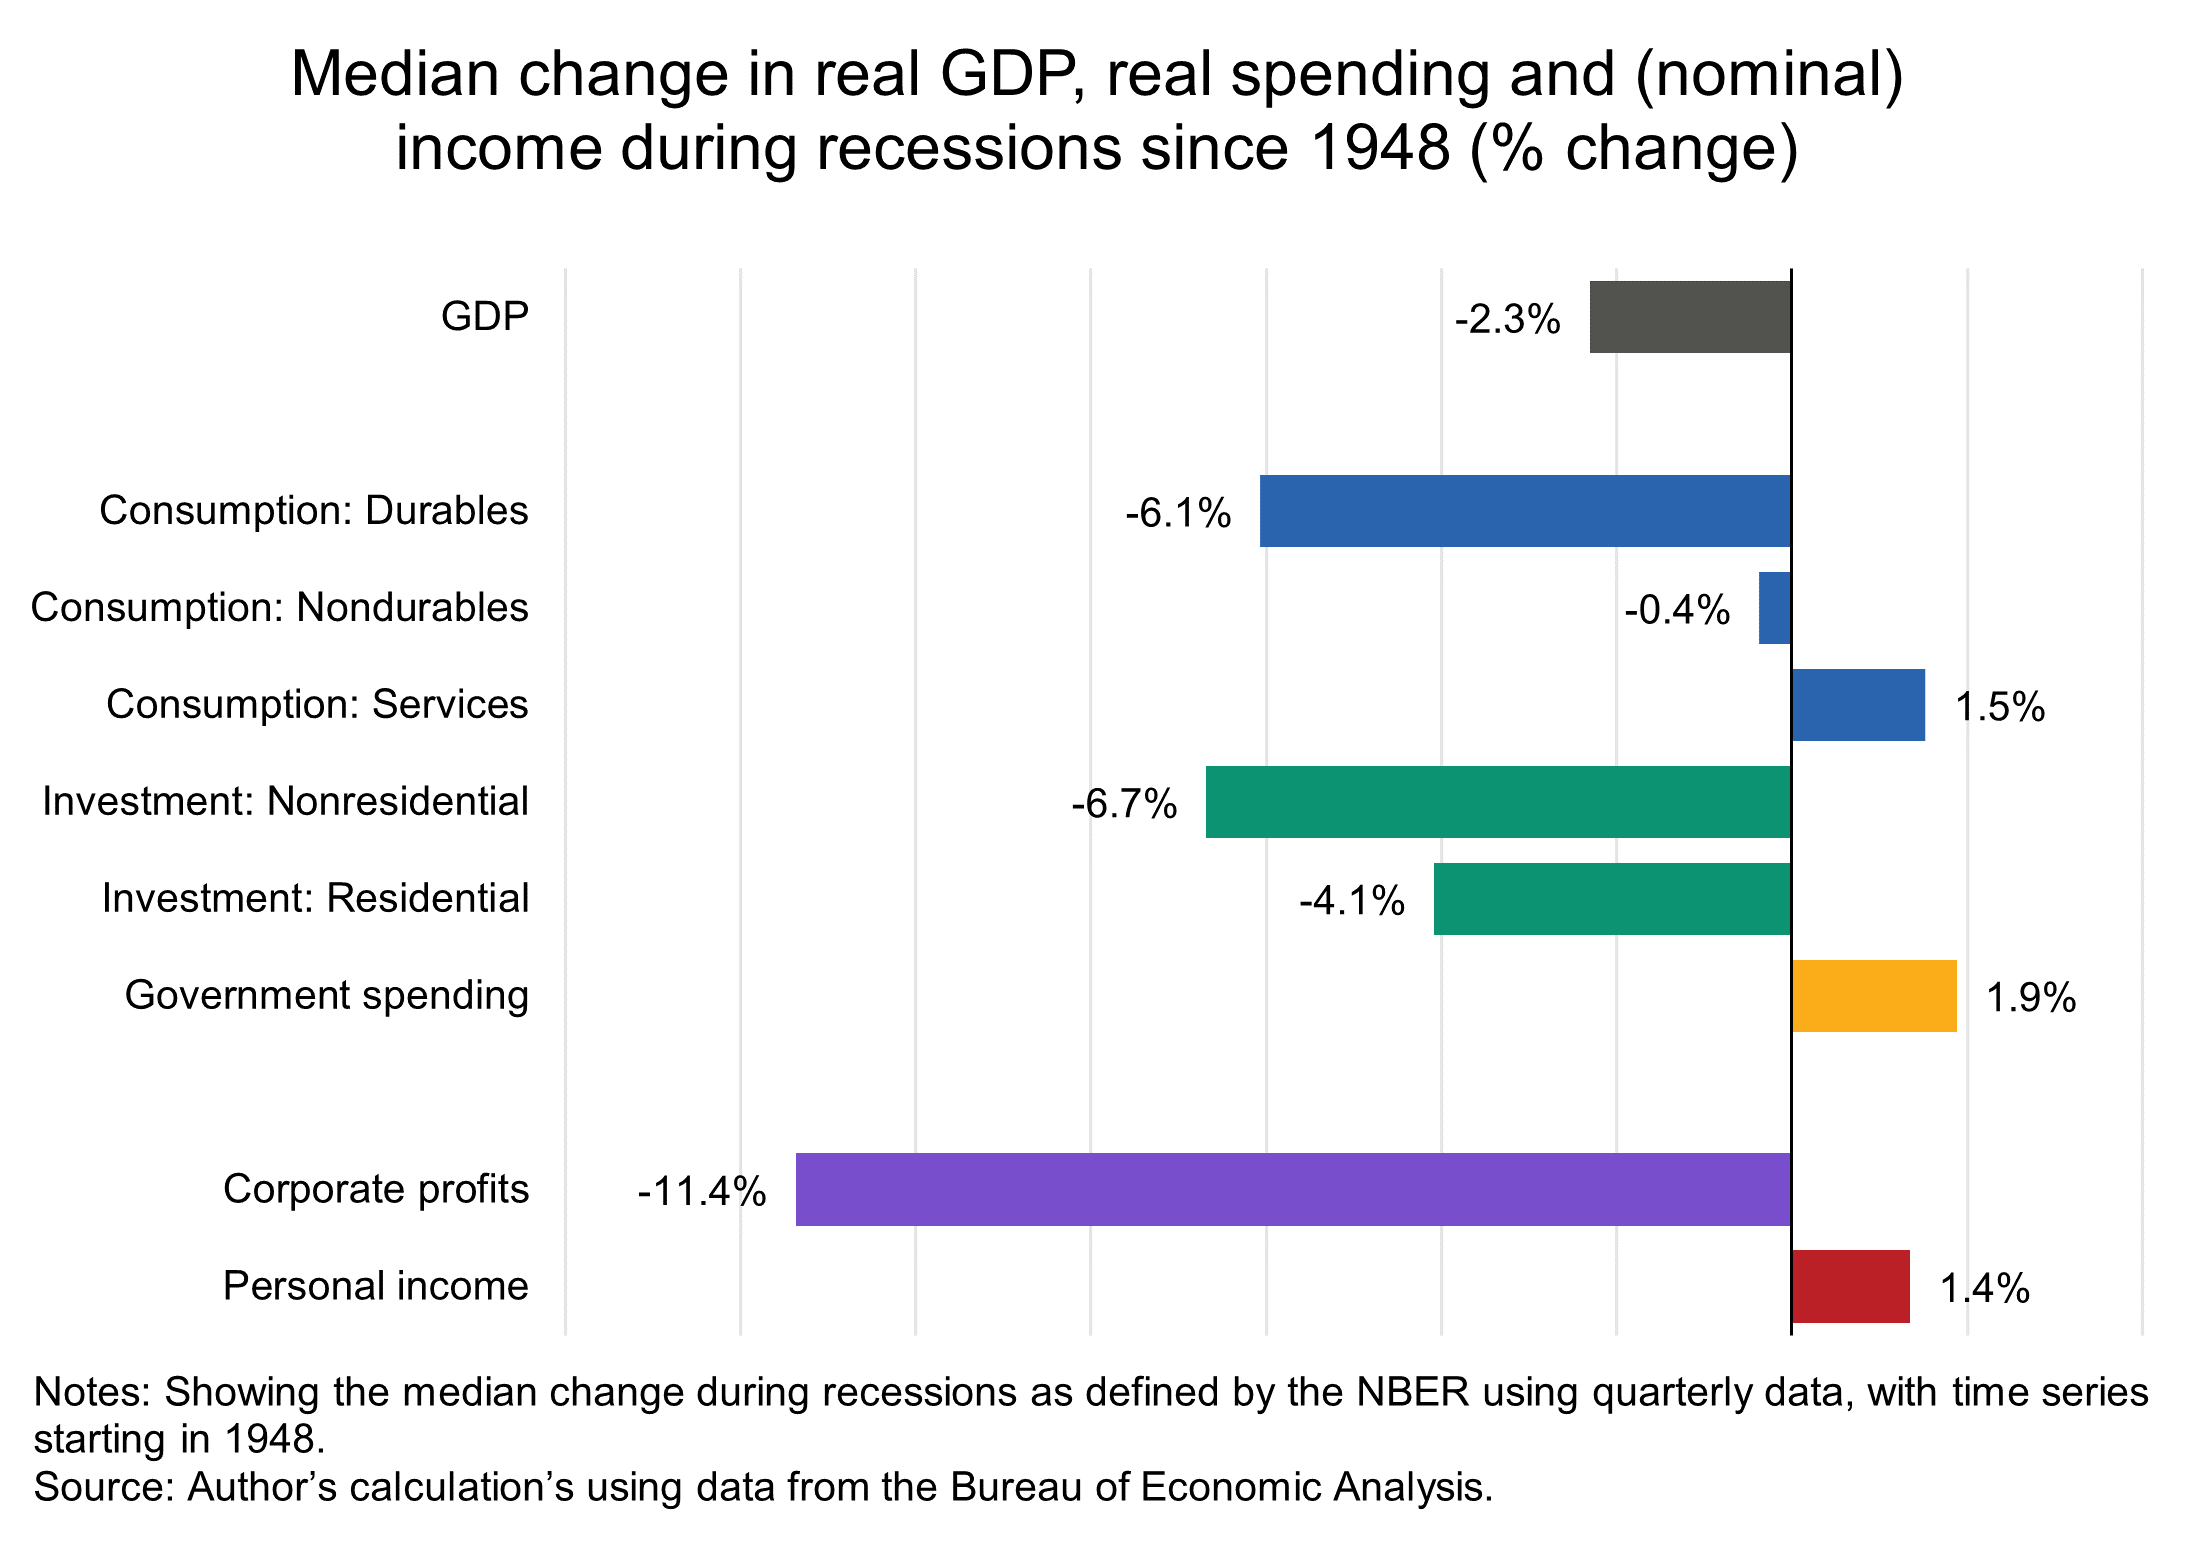
With regards to consumption, it’s mostly the consumption of durable goods that is heavily cut back. Spending on nondurables is typically unchanged and, interestingly, expenditures on services even go up slightly during recessions.
Not every recession meets the median, either in cause or in outcome. One outlier is the Global Financial Crisis of 2008-09, when the financial system collapsed and real investment declined precipitously (three times the median for all postwar recessions). Another outlier is the shutdown of 2020 in response to the global pandemic, which led to a halt in consumption 27 times the median for all postwar recessions. In other recessions, the GDP decline is very mild, as in the recessions of the 1960s, or even mildly positive but well below the previous trend, as with the dot-com crash of 2000-01, which affected employment much more than economic growth. Furthermore, recessions have become less common in the US over time. Whereas recessions through the 1960s were 20 to 40 months apart, the time lag has risen significantly to more than 80 months since the 1981 recession. The 2020 pandemic recession was the first recession in 129 months.
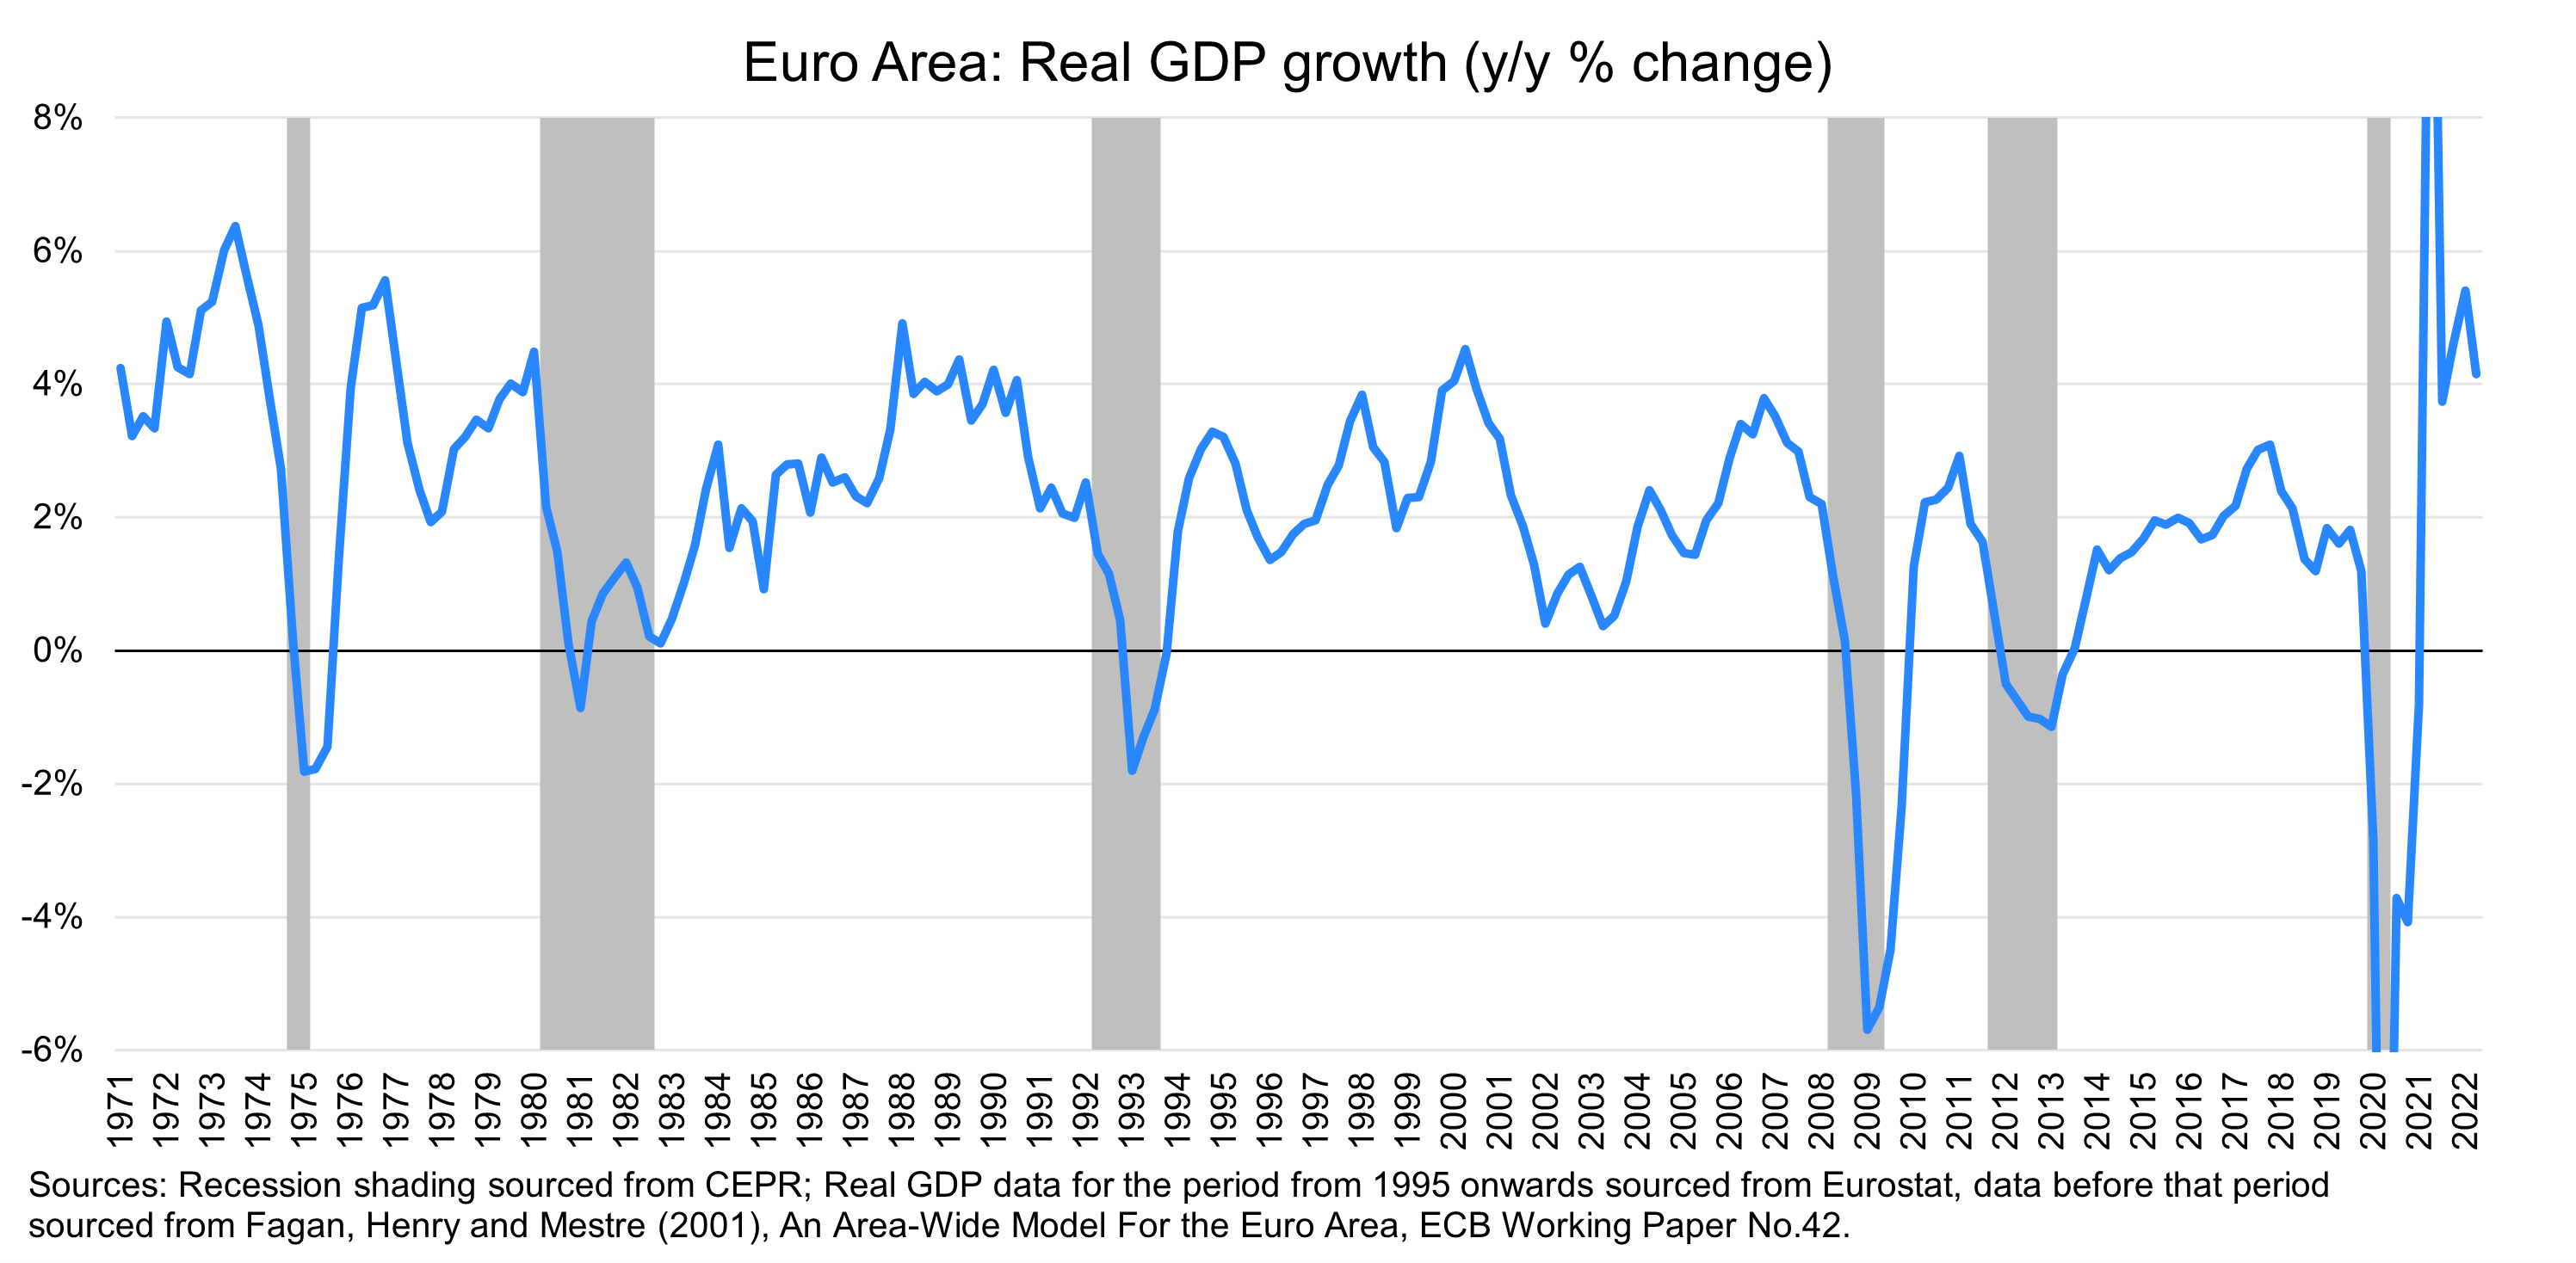
The median recession in the Euro Area lasts about five quarters (a key difference with the US is that recessions in the Euro Area are dated in quarters, not months) with a decline in real GDP of 2.2 percent. According to the Center for Economic and Policy Research (CEPR) dating of (aggregate) Euro Area recessions, until 2008, recessions had become less frequent, with the time between them increasing as in the US. The sovereign debt crisis–fueled recession of 2011 broke with that pattern, however, occurring only three years after the 2008 recession.[1] The GDP decline observed in the median recession is largely driven by declining investment, with consumption only dropping moderately and government spending increasing. As with the US, recessions have varied in terms of magnitude, with some quarters in the 1980 recessionary period not even showing a decline in real GDP. As in the US, the pandemic-driven recession of 2020 was an outlier, with a large fall in both consumption and investment, and even a decline in government expenditure.
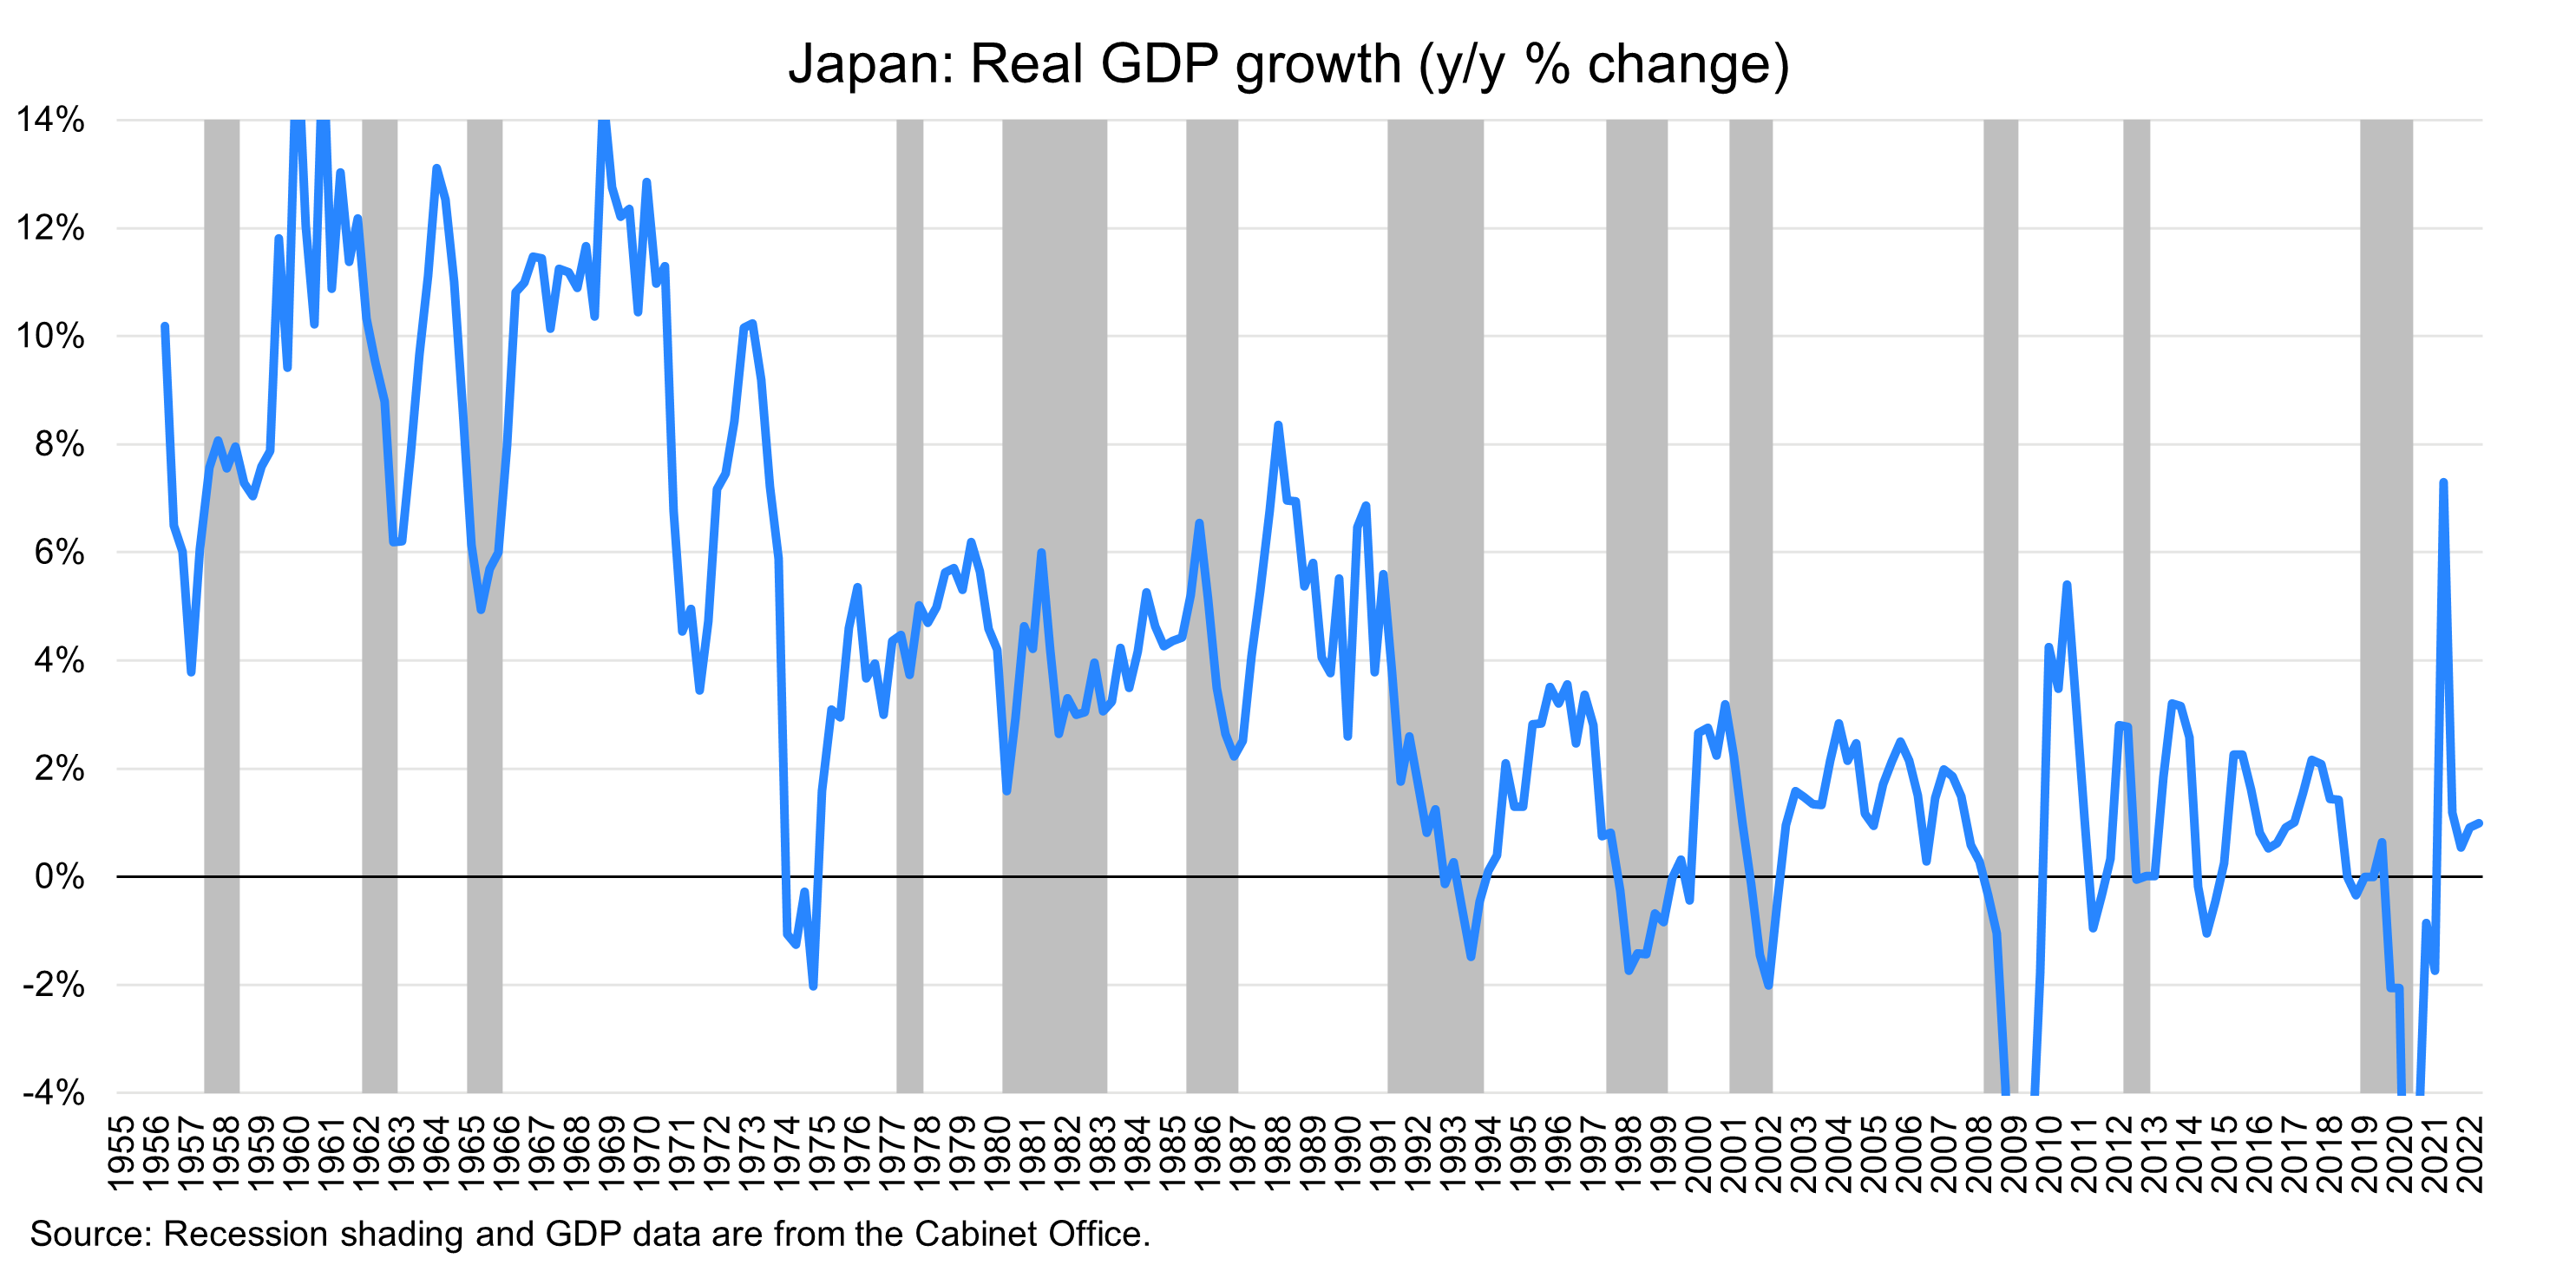
Recessions in Japan have occurred at relatively regular intervals, with the GDP declines increasing over time. The Cabinet Office has registered 16 recessions since the 1950s, with a median length of 14 months with 29 months between them. Even though Japan’s definition of recession is relatively similar to those of NBER and CEPR, there are important differences. For example, the seven recessions that occurred between 1955 and 1991 did not see GDP declines, but rather slowdowns in growth. Furthermore, with a few exceptions, recessions have occurred at relatively frequent intervals and been of similar lengths. Finally, whereas the US and the Euro Area plunged into recession because of the pandemic shutdowns in 2020, Japan had already been in recession since November 2018. However, the end date (May 2020 or the second quarter) of the pandemic-driven recession is similar across the US, Euro Area, and Japan. Since the 1991 recession, GDP declines during recessions were mostly driven by reductions in investment, as has been the case in the US and the Euro Area.
[1] Several authors have suggested treating the global financial crisis and the sovereign debt crisis in the Euro Area as one period; see, for example, Adam Tooze, Crashed: How a Decade of Financial Crises Changed the World (Viking: 2018).
