
The Consumer Confidence Survey® reflects prevailing business conditions and likely developments for the months ahead. This monthly report details consumer attitudes, buying intentions, vacation plans, and consumer expectations for inflation, stock prices, and interest rates. Data are available by age, income, 9 regions, and top 8 states.
US Consumer Confidence Inched Up in June
Latest Press Release
Updated: Tuesday, June 30, 2026
Consumers downgraded their assessment of the current labor market but expect some improvement in business and financial conditions ahead
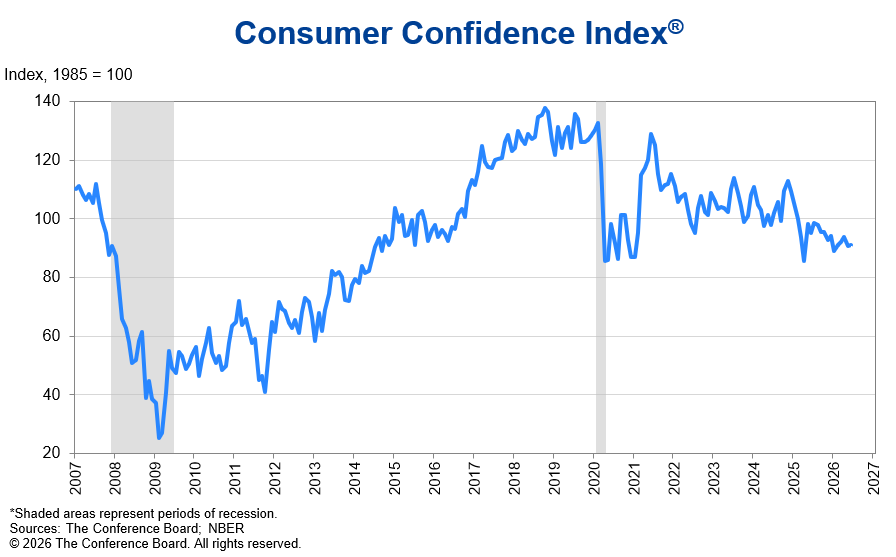
The Conference Board Consumer Confidence Index® inched up by 0.6 points to 91.2 (1985=100) in June, up from a downwardly revised 90.6 in May. The Present Situation Index—based on consumers’ assessment of current business and labor market conditions—fell by 3.0 points to 116.4. The Expectations Index—based on consumers’ short-term outlook for income, business, and labor market conditions—rose by 3.0 points to 74.4. The survey period for this month’s preliminary results was June 1–23, encompassing an extension of the US-Iran ceasefire agreement.
“Consumer confidence inched up in June as falling oil prices in recent weeks provided some relief to consumer inflation fears,” said Dana M Peterson, Chief Economist, The Conference Board. “Consumer appraisals of current business conditions were slightly more positive compared to last month. However, perceptions of the current labor market softened measurably as the percentage of consumers saying jobs were ‘hard to get’ rose to 22.5%, the highest level since January 2021 (22.8%). Moreover, consumers anticipate little change in the labor market six months from now. This was offset by improving expectations for business conditions and incomes.”
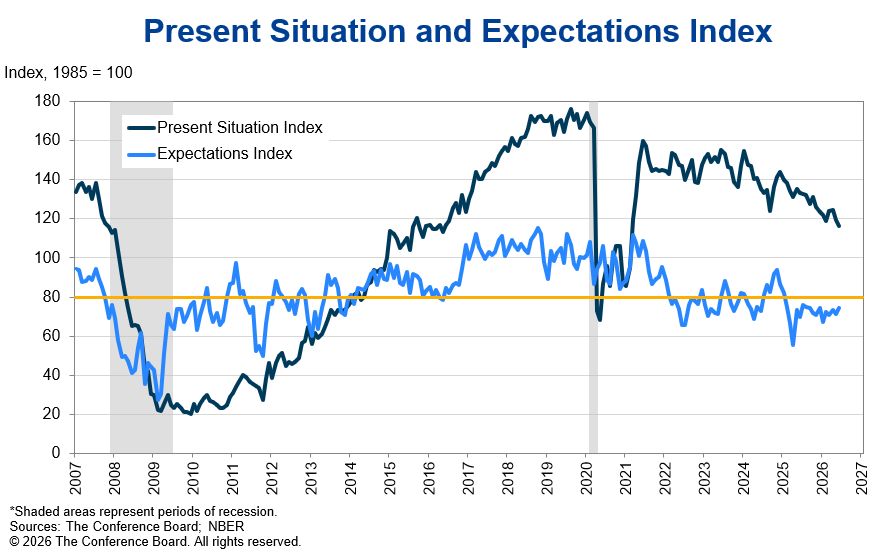
The Present Situation Index declined in June. Net views of current business conditions—the share saying conditions are “good” versus “bad”—improved by 1 ppt to +3.5%. However, perceptions of current employment conditions declined, with the labor market differential—the share of consumers saying jobs are “plentiful” minus the share saying jobs are “hard to get”—declining by 2.6 ppts to just +2.4%. Notably, the percentage of consumers saying jobs are “hard to get” rose to 22.5%, a five-and-a-half-year high (January 2021, 22.8%).
The Expectations Index improved in June, with two of its three components—net expectations for business and expected household income six months from now both improving. Net expectations for labor market conditions were unchanged.
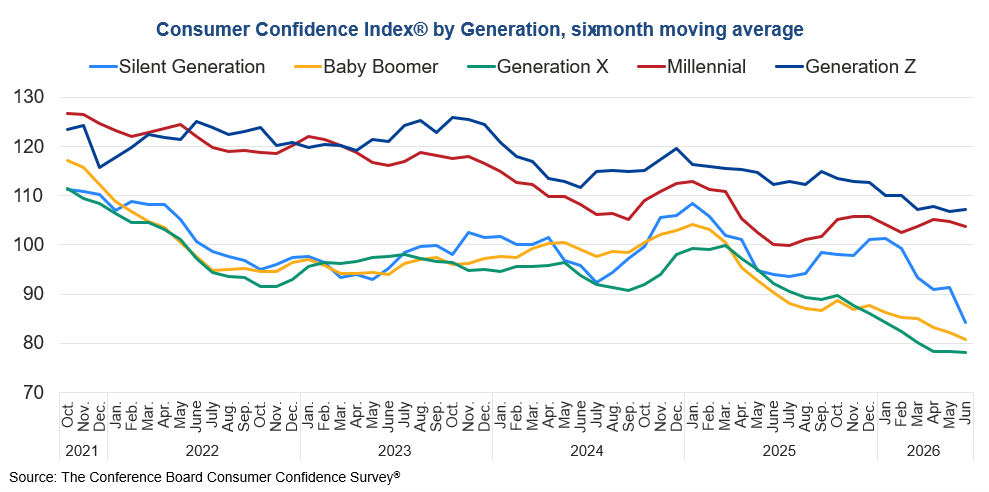
Among age groups, confidence for consumers under age 35 remained the highest, but confidence for all age groups trended downward on a six-month moving average basis. By income, on a six-month moving average basis, confidence was mixed or little changed across all categories. By generation, confidence fell the most for the Silent Generation but was stable or lower for others on a six-month moving average basis. By political affiliation, confidence among Independents and Democrats rose while Republicans were somewhat less positive on a month-over-month basis.
Consumers’ write-in responses on factors affecting the economy continued to skew towards pessimism in June. References to prices and oil and gas eased in frequency but remain elevated. Mentions of war, geopolitics, and conflict eased, reflecting some easing of consumer concerns about the inflationary impacts of the war in the Middle East.
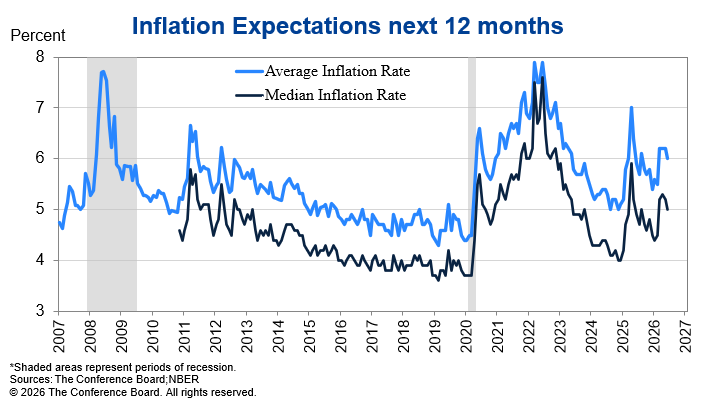
Consumers’ average and median 12-month inflation expectations were less elevated. While down somewhat from May (62.4%), most consumers (61.5%) in June still expected higher interest rates over the next 12 months. Equity market volatility, notwithstanding, the second half of the June survey period included an extension of the US-Iran ceasefire and likely influenced consumer expectations of even higher stock prices a year from now.
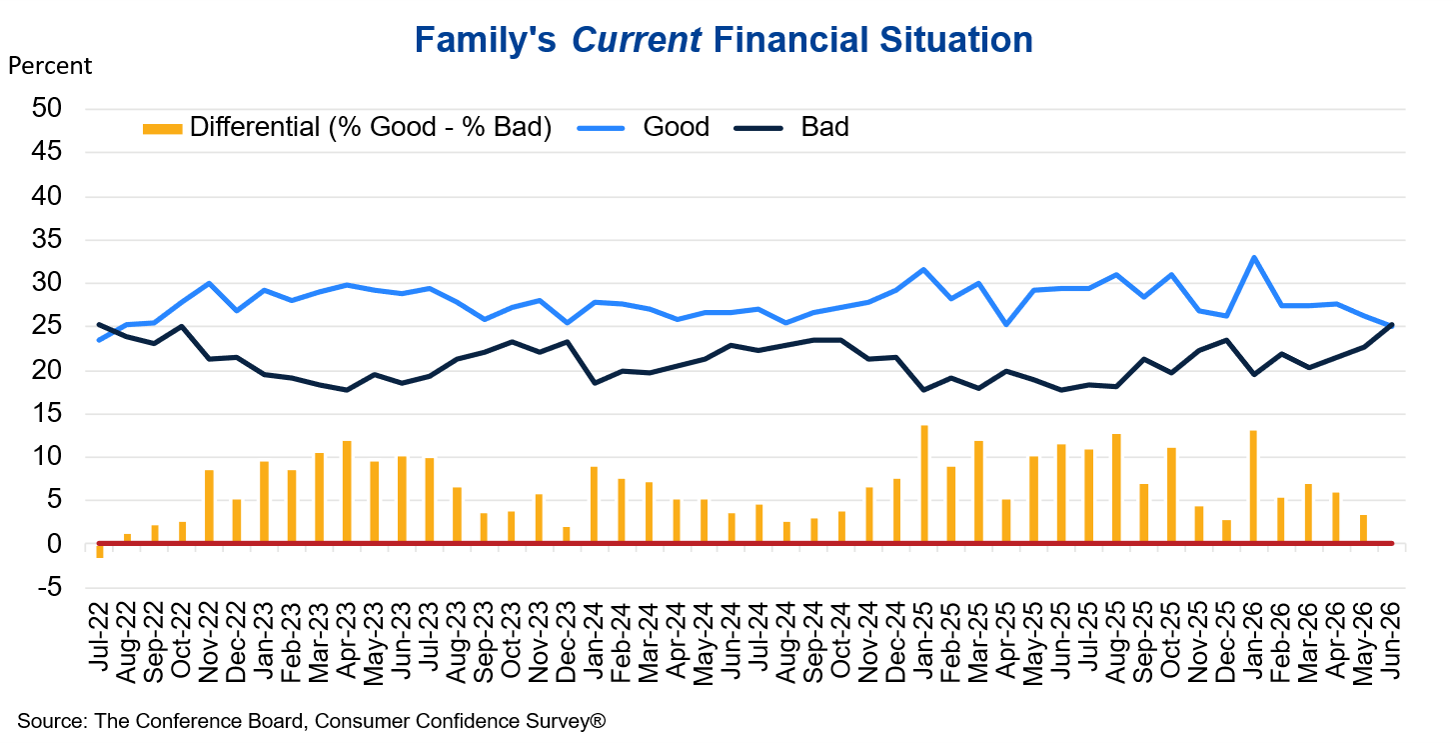
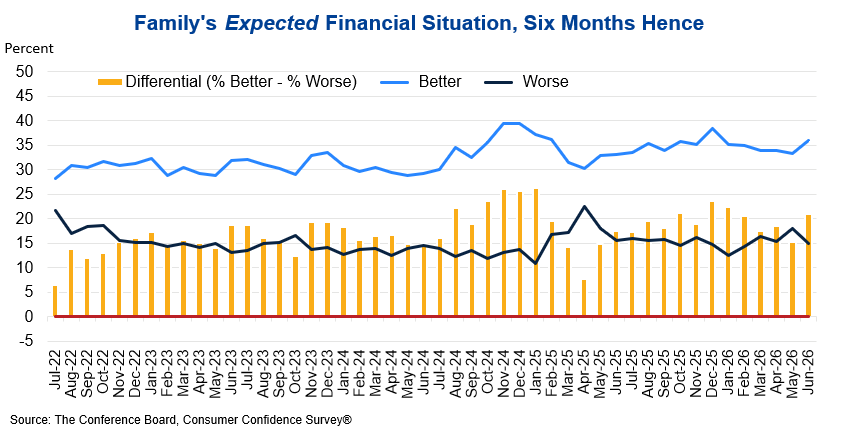
Consumers’ net views of their Family’s Current Financial Situation deteriorated for a third month, with virtually the same portion saying conditions are “Good” versus “Bad.” However, consumer’s views of their Family’s Future Financial Situation were more optimistic, reviving the levels since the beginning of the year. Meanwhile, the share of consumers who said a US recession over the next 12 months is “somewhat likely” rose, but overall recession expectations remain low, with those saying recession is “not likely” declining. (These measures are not included in calculating the Consumer Confidence Index®).
Consumers’ plans to buy big-ticket items over the next six months improved slightly, shifting from “no” to “maybe”, and the proportion saying “yes” picked up modestly. Buying plans for autos continued rising on a six-month moving average basis in June. Homebuying expectations also rose on a six-month rolling basis. Consumers planning purchases six months ahead continued to rank furniture followed by smartphones as the most desired items, but expectations for both categories moderated further in June. Spending plans for white goods and electronics eased a tad or were relatively unchanged on a six-month moving average basis.
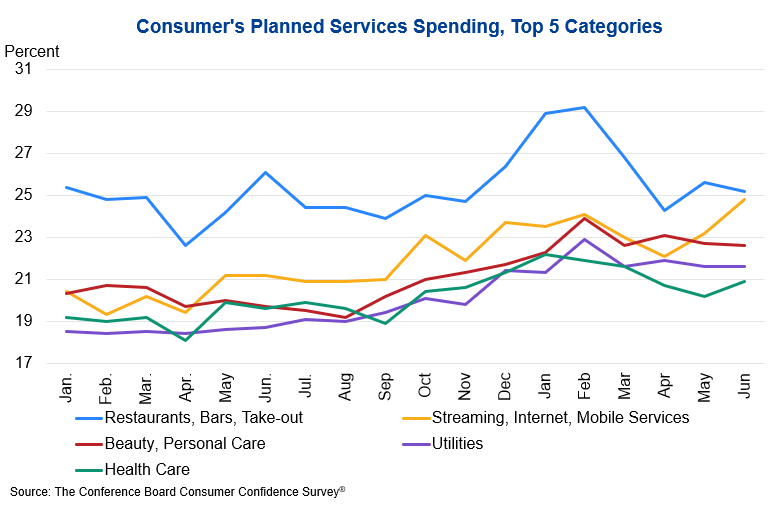
Consumers planning more spending on services over the next six months shifted from “no” to “maybe” in June, but future spending plans on individual services were mixed. Among all service categories, restaurants/bars/take-out, streaming/internet/mobile services, and beauty and personal care, remained among the top three spending targets.
Overall travel intentions within six months receded in June but predominately fell for domestic travel plans, while plans for international travel rose. Nonetheless, expected spending on hotel/motel and airfare/trains for personal travel were moderately higher in the month.
Present Situation
Consumers’ views of current business conditions improved in June.
- 20.0% of consumers said business conditions were “good,” up from 19.2% in May.
- 16.5% said business conditions were “bad,” down from 16.7%.
On net, consumers’ views of the labor market worsened in June.
- 24.9% of consumers said jobs were “plentiful,” up slightly from 24.8% in May.
- Conversely, 22.5% of consumers said jobs were “hard to get,” up from 19.8%.
Expectations Six Months Hence
Consumers were more optimistic about future business conditions in June.
- 19.0% of consumers expected business conditions to improve, up from 18.8% in May.
- 20.3% expected business conditions to worsen, down from 23.2%.
On net, consumers’ negative stance about the labor market outlook was largely unchanged in June.
- 15.2% of consumers expected more jobs to be available, down from 16.6% in May.
- However, 25.6% anticipated fewer jobs, down from 27.0%.
Consumers’ outlook for their income prospects was more optimistic in June.
- 20.8% of consumers expected their incomes to increase, up from 19.2% in May.
- 13.2% expected their incomes to decline, down from 14.5%.
The monthly Consumer Confidence Survey®, based on an online sample, is conducted for The Conference Board by Toluna, a technology company that delivers real-time consumer insights and market research through its innovative technology, expertise, and panel of over 36 million consumers. The cutoff date for the preliminary results was June 23.
Source: June 2026 Consumer Confidence Survey®
The Conference Board
The Conference Board publishes the Consumer Confidence Index® at 10 a.m. ET on the last Tuesday of every month. Subscription information and the technical notes to this series are available on The Conference Board website: https://www.conference-board.org/data/consumerdata.cfm.
About The Conference Board
The Conference Board is the Member-driven think tank that delivers Trusted Insights for What's Ahead®®. Founded in 1916, we are a nonpartisan, not-for-profit organization holding 501 (c) (3) tax-exempt status in the United States. TCB.org l Learn about Membership
The next release is Tuesday, July 28 at 10 AM ET.
© The Conference Board 2026. All data contained in this table are protected by United States and international copyright laws. The data displayed are provided for informational purposes only and may only be accessed, reviewed, and/or used in accordance with, and the permission of, The Conference Board consistent with a subscriber or license agreement and the Terms of Use displayed on our website at www.conference-board.org. The data and analysis contained herein may not be used, redistributed, published, or posted by any means without express written permission from The Conference Board.
COPYRIGHT TERMS OF USE All material on Our Sites are protected by United States and international copyright laws. You must abide by all copyright notices and restrictions contained in Our Sites. You may not reproduce, distribute (in any form including over any local area or other network or service), display, perform, create derivative works of, sell, license, extract for use in a database, or otherwise use any materials (including computer programs and other code) on Our Sites ("Site Material"), except that you may download Site Material in the form of one machine readable copy that you will use only for personal, noncommercial purposes, and only if you do not alter Site Material or remove any trademark, copyright or other notice displayed on the Site Material. If you are a subscriber to any of the services offered on Our Sites, you may be permitted to use Site Material, according to the terms of your subscription agreement.
Trademarks "THE CONFERENCE BOARD," the TORCH LOGO, "CONSUMER CONFIDENCE SURVEY", "CONSUMER CONFIDENCE INDEX", and other logos, indicia and trademarks featured on Our Sites are trademarks owned by The Conference Board, Inc. in the United States and other countries ("Our Trademarks").
You may not use Our Trademarks in connection with any product or service that does not belong to us nor in any manner that is likely to cause confusion among users about whether The Conference Board is the source, sponsor, or endorser of the product or service, nor in any manner that disparages or discredits us.


