


International Comparisons of Hourly Compensation Costs in Manufacturing, 2016 - China and India
16 February 2018
Chart 4. Manufacturing hourly compensation costs in China and India, US dollars
Chart 4. Manufacturing hourly compensation costs in China and India, US dollars
Click on image to view chart
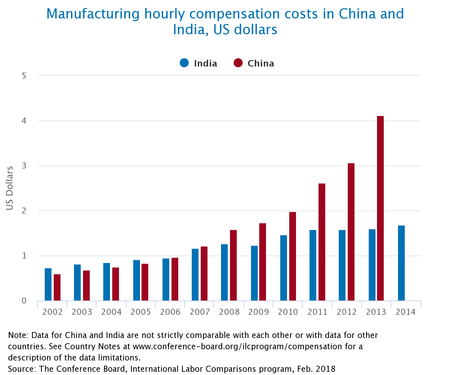
Chart 5. Manufacturing employers' social insurance expenditures as a percent of total compensation costs
Click on image to view chart

| Hourly Compensation Costs(1) | ||||||
| US Dollars | US = 100 | |||||
| China (2) | India (3) | China | India | |||
| 1999 | NA | 0.68 | NA | 2.9 | ||
| 2000 | NA | 0.70 | NA | 2.8 | ||
| 2001 | NA | 0.71 | NA | 2.7 | ||
| 2002 | 0.60 | 0.73 | 2.2 | 2.7 | ||
| 2003 | 0.68 | 0.81 | 2.4 | 2.8 | ||
| 2004 | 0.75 | 0.85 | 2.6 | 2.9 | ||
| 2005 | 0.84 | 0.91 | 2.8 | 3.0 | ||
| 2006 | 0.96 | 0.95 | 3.1 | 3.1 | ||
| 2007 | 1.21 | 1.17 | 3.8 | 3.6 | ||
| 2008 | 1.59 | 1.26 | 4.9 | 3.8 | ||
| 2009 | 1.74 | 1.23 | 5.1 | 3.6 | ||
| 2010 | 1.98 | 1.46 | 5.7 | 4.2 | ||
| 2011 | 2.62 | 1.59 | 7.4 | 4.5 | ||
| 2012 | 3.06 | 1.59 | 8.6 | 4.5 | ||
| 2013 | 4.11 | 1.60 | 11.3 | 4.4 | ||
| 2014 | NA | 1.69 | NA | 4.6 | ||
| 2015 | NA | NA | NA | NA | ||
| 2016 | NA | NA | NA | NA | ||
For country information and a description of data limitations associated with estimates for China and India, see the Country Notes.
(1) Due to various data gaps and methodological issues, compensation costs for China and India are not directly comparable to each other or with the data for other countries found in this report, and therefore are presented separately.
(2) Data on manufacturing compensation and employees in China refer to registered "urban units" in urban areas and registered "town and village enterprises" (TVEs) in rural areas. Manufacturing enterprises in both urban and rural areas are registered based on location and refer to enterprises of all sizes (there are no reporting cut-offs based on number of employees or revenue). However, registered enterprises represent only formal sector manufacturing captured by government registration records. Manufacturing workers in unregistered or informal manufacturing, who earn substantially less than their formal sector counterparts, are not represented in these data. Further, urban unit data are highly skewed toward the state-owned sector, introducing further bias in the final estimates.
(3) Compensation costs data for India refer to the organized manufacturing sector, that is, the portion of India’s manufacturing activity that is formally registered with state governments and is therefore subject to regulation. The unorganized sector is not regulated, and little data exist for its enterprises. The lack of information on the unorganized sector means that manufacturing workers in unorganized or informal manufacturing, who earn substantially less than their organized sector counterparts, are not represented in these data.
Source: The Conference Board, International Labor Comparisons program, February 2018
© The Conference Board 2018. All data contained in this table are protected by United States and international copyright laws. The data displayed are provided for informational purposes only and may only be accessed, reviewed, and/or used in accordance with, and the permission of, The Conference Board consistent with a subscriber or license agreement and the Terms of Use displayed on our website at www.conference-board.org. The data and analysis contained herein may not be used, redistributed, published, or posted by any means without express written permission from The Conference Board.
COPYRIGHT TERMS OF USE
All material on Our Sites are protected by United States and international copyright laws. You must abide by all copyright notices and restrictions contained in Our Sites. You may not reproduce, distribute (in any form including over any local area or other network or service), display, perform, create derivative works of, sell, license, extract for use in a database, or otherwise use any materials (including computer programs and other code) on Our Sites ("Site Material"), except that you may download Site Material in the form of one machine readable copy that you will use only for personal, noncommercial purposes, and only if you do not alter Site Material or remove any trademark, copyright or other notice displayed on the Site Material. If you are a subscriber to any of the services offered on Our Sites, you may be permitted to use Site Material, according to the terms of your subscription agreement.
Trademarks "THE CONFERENCE BOARD," the TORCH LOGO, and other logos, indicia and trademarks featured on Our Sites are trademarks owned by The Conference Board, Inc. in the United States and other countries ("Our Trademarks").
You may not use Our Trademarks in connection with any product or service that does not belong to us nor in any manner that is likely to cause confusion among users about whether The Conference Board is the source, sponsor, or endorser of the product or service, nor in any manner that disparages or discredits us.
The use of all TCB data and materials is subject to the Terms of Use. Reprint requests are reviewed individually and may be subject to additional fees. TCB reserves the right to deny any request.

