
Loading...
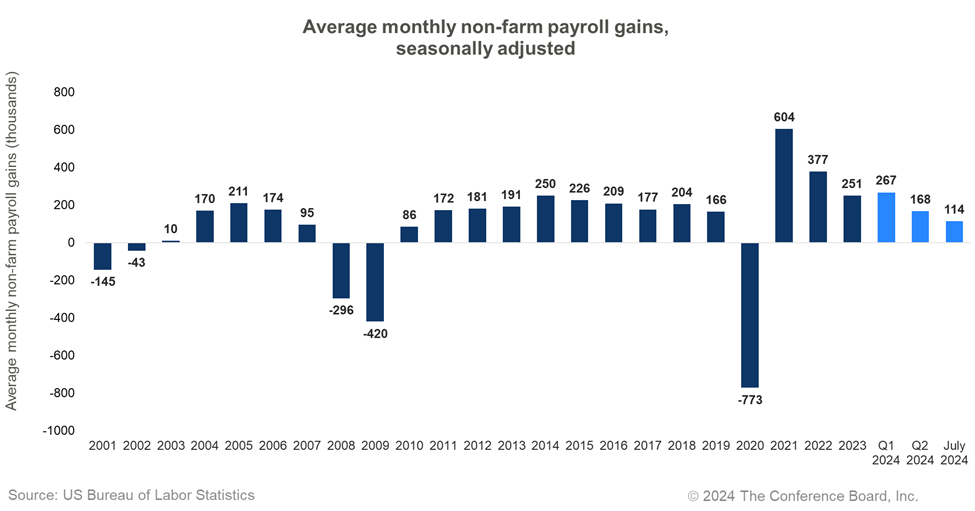
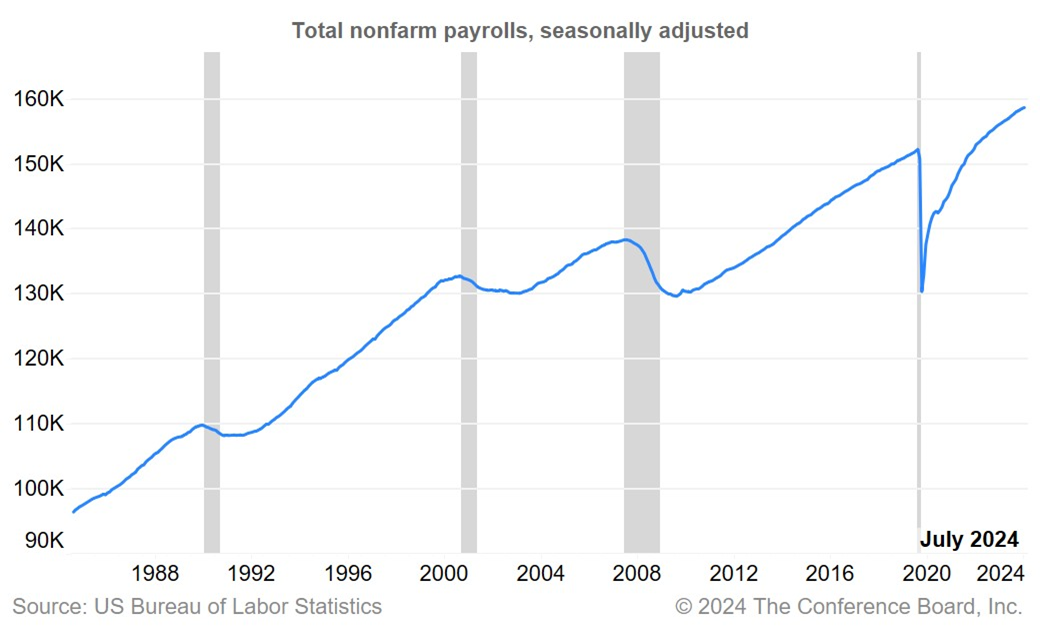
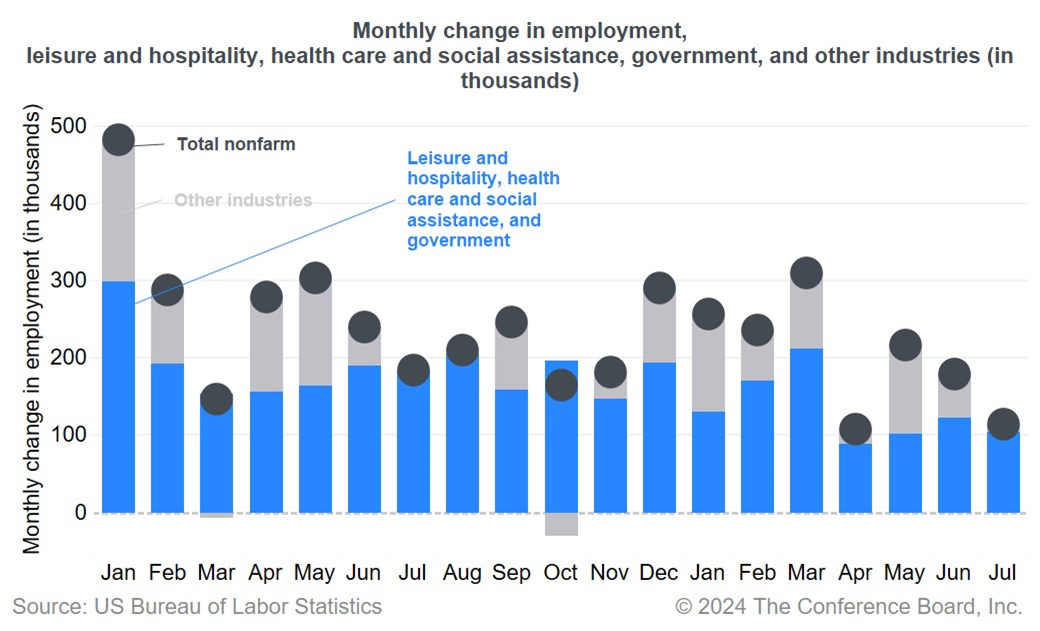
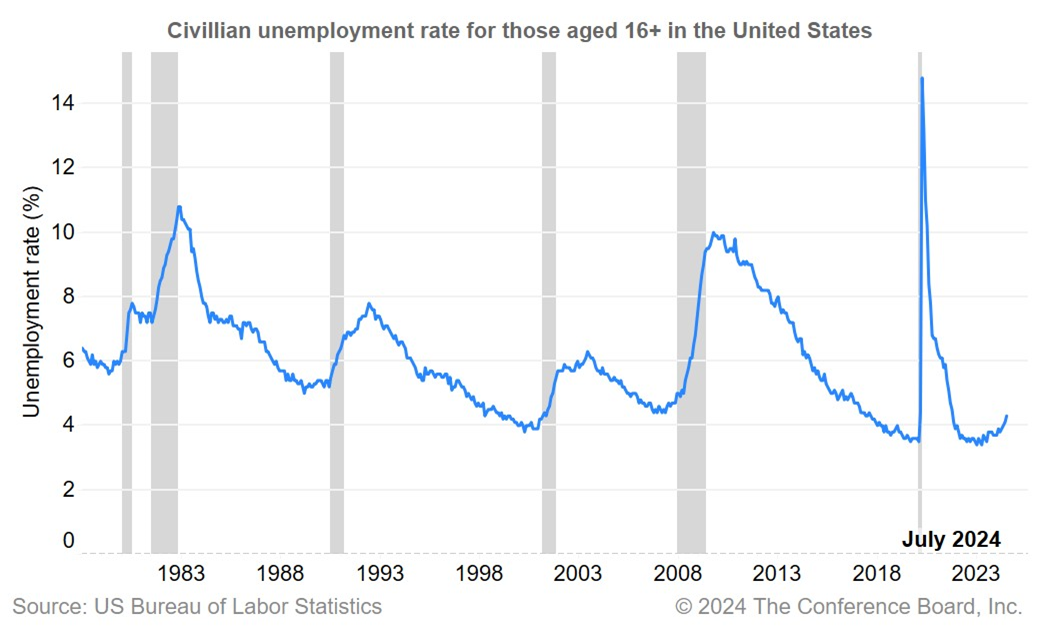
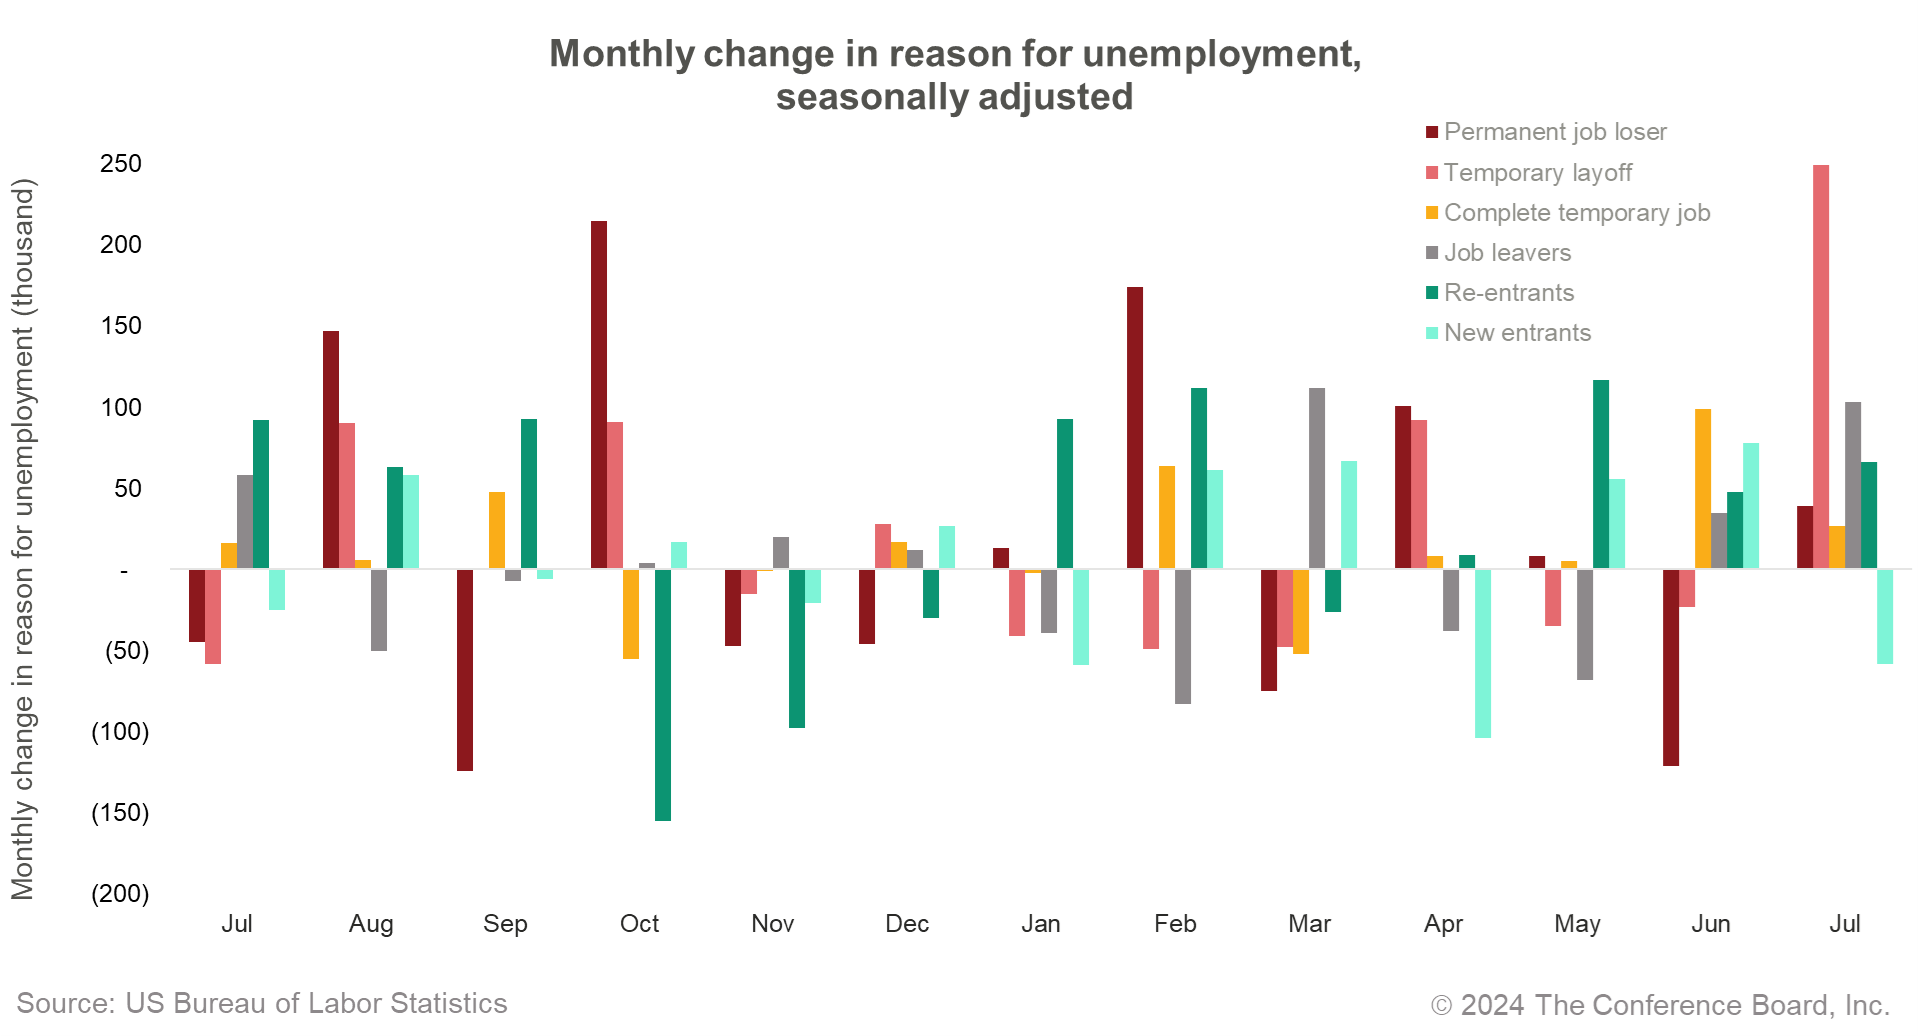
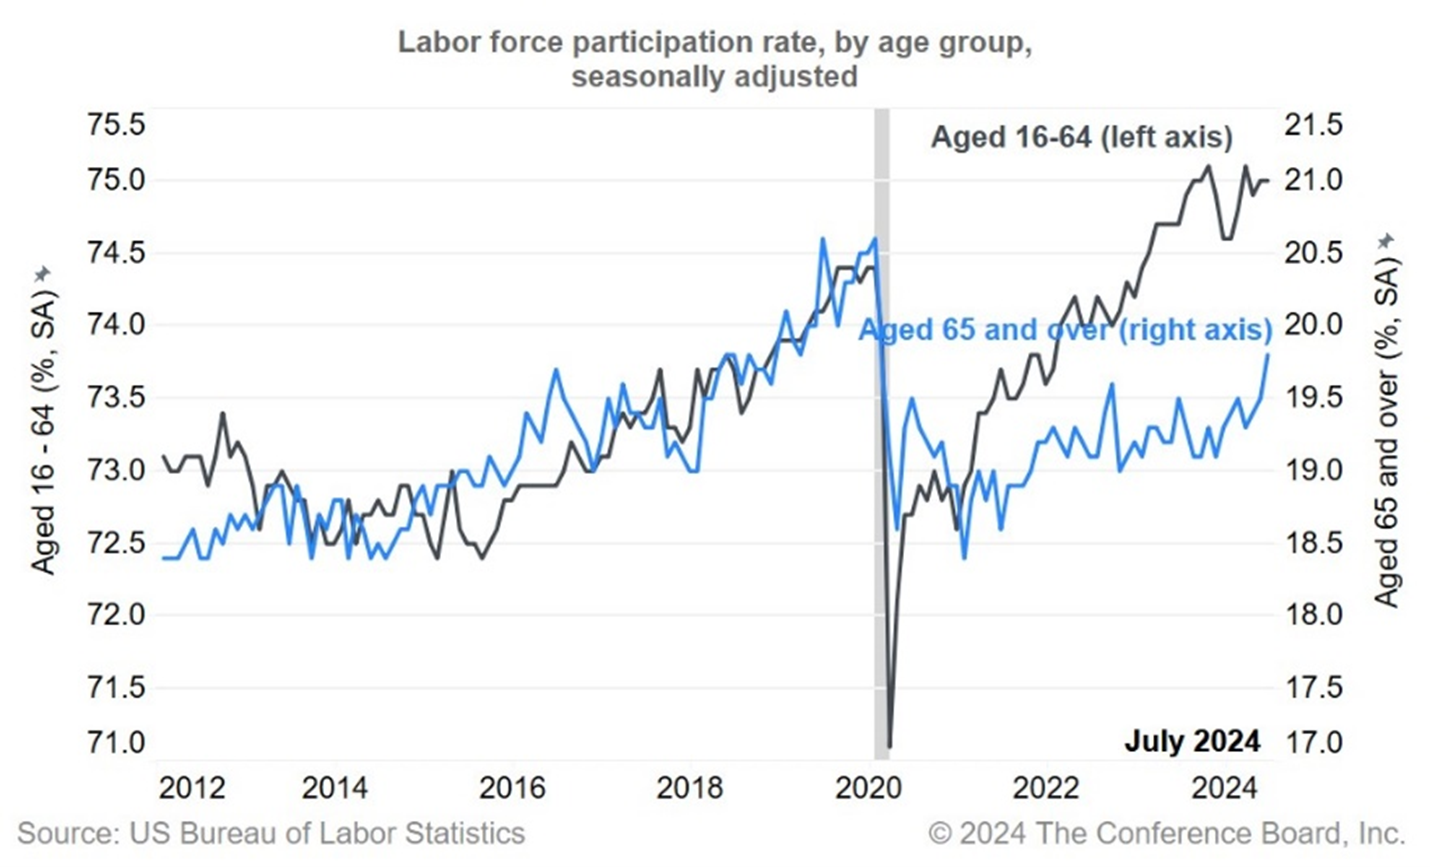
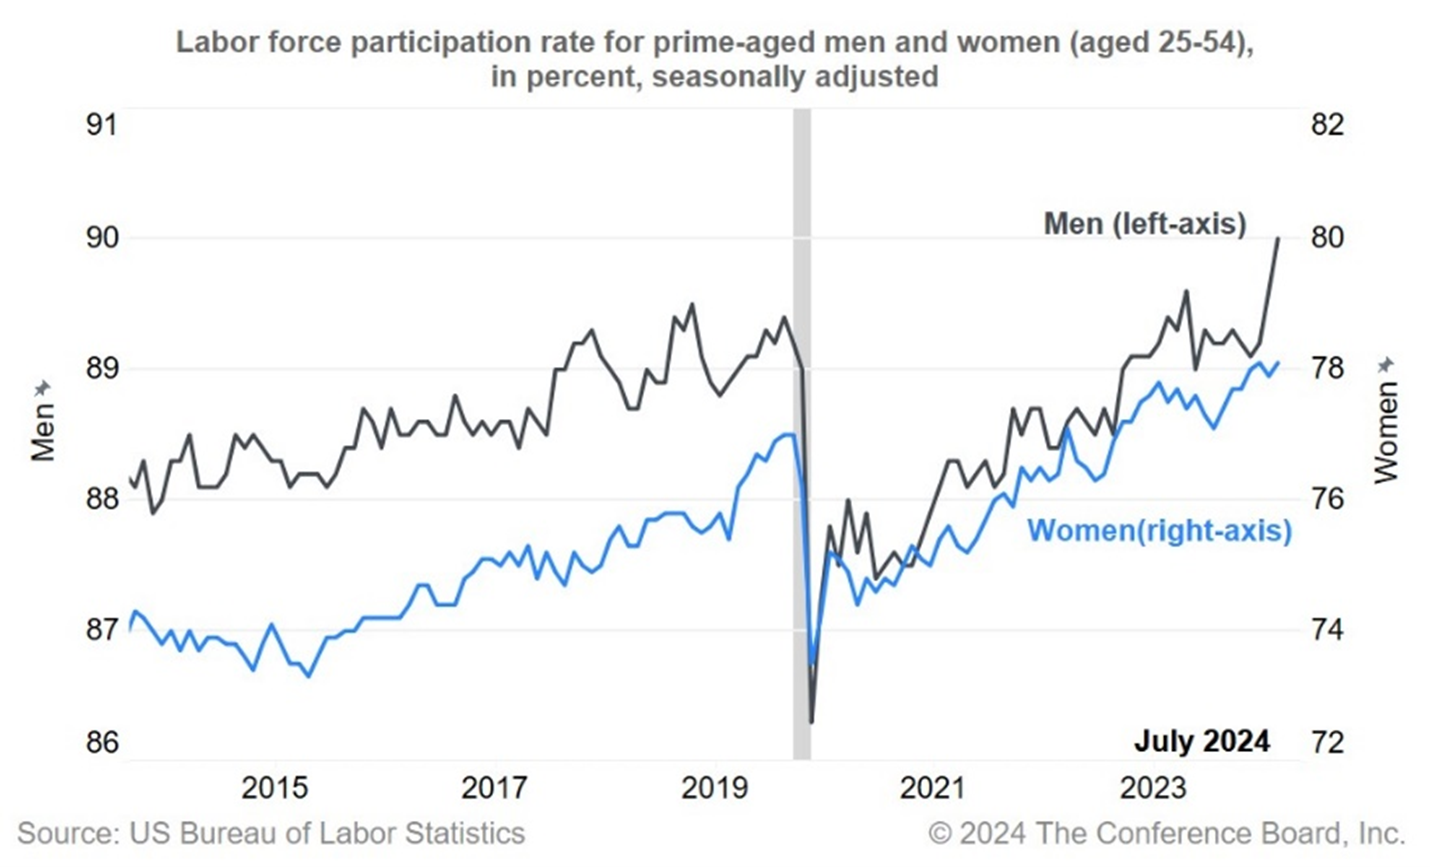
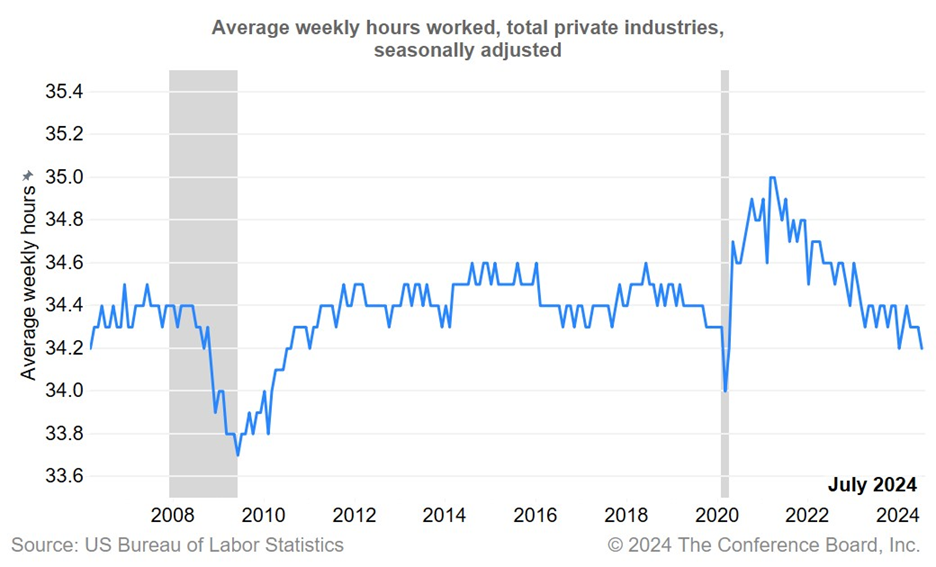
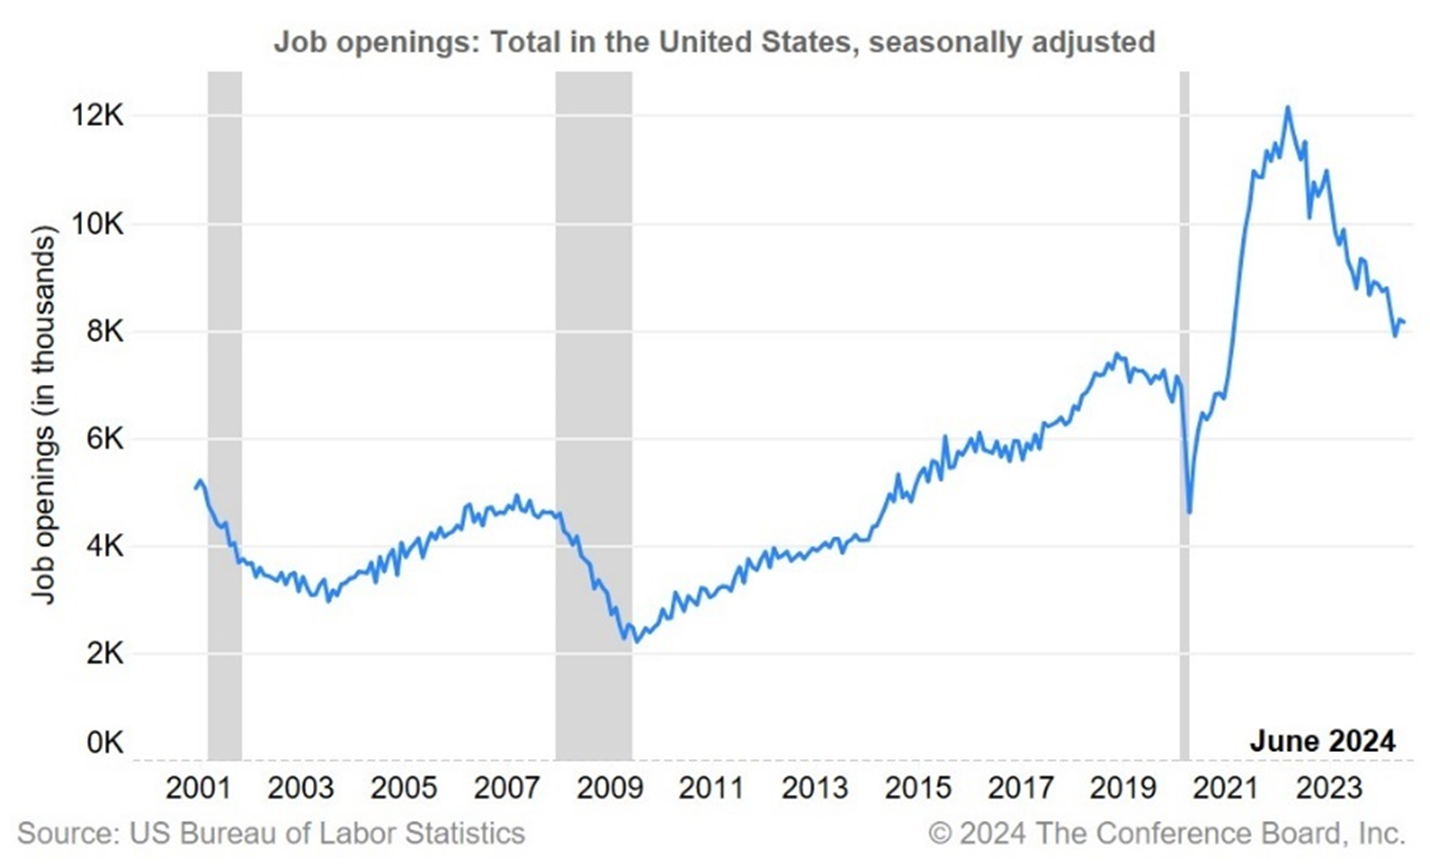
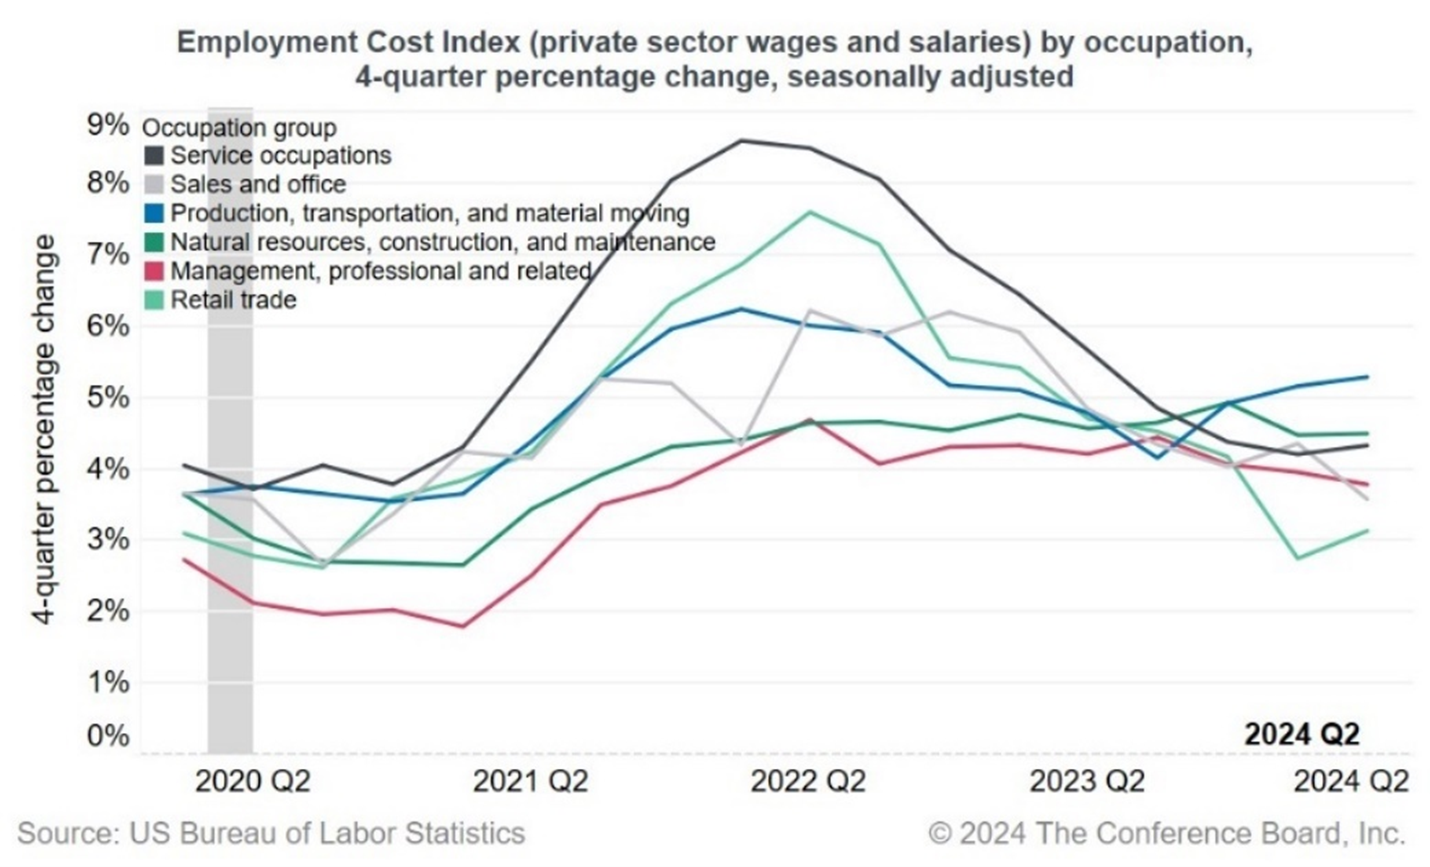
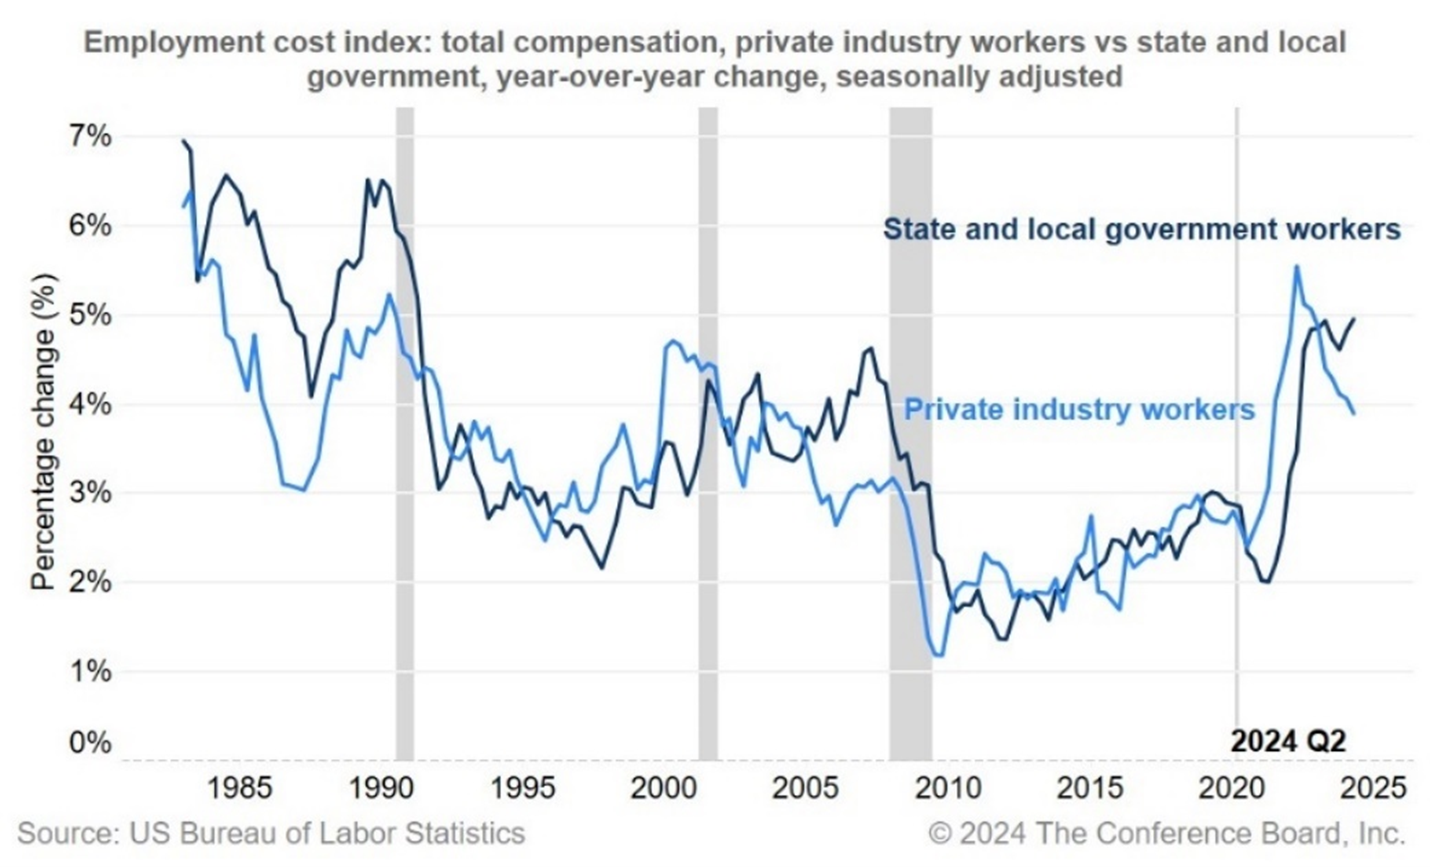
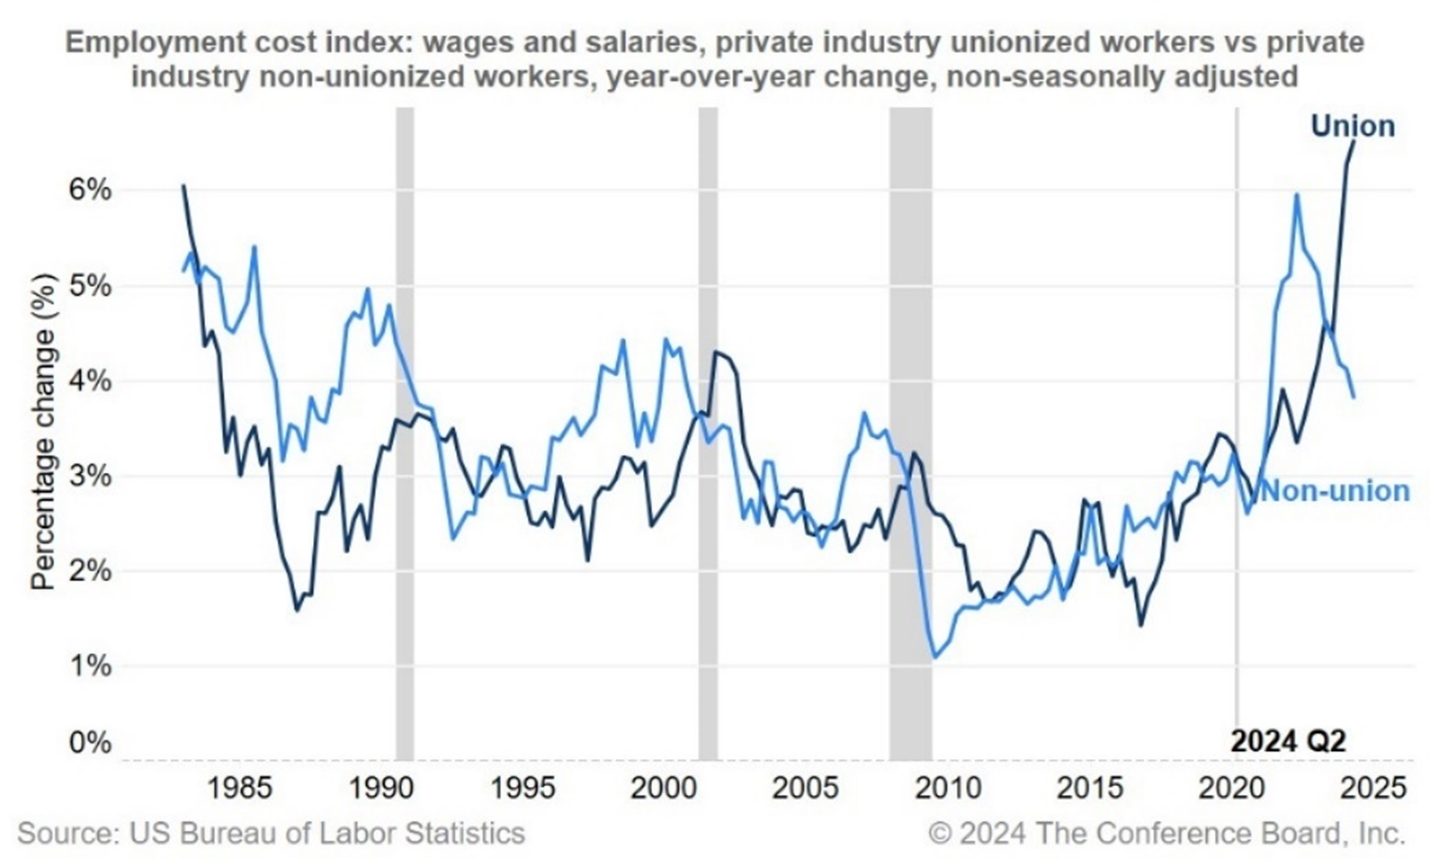
Payroll employment growth cooled in July, falling to 114,000 from June’s downwardly revised 179,000. While job growth continued to be concentrated in certain sectors, employment gains were still sizable and exceeded 2019 levels. Yet, July’s report provided a softening signal with the unemployment rate ticking up to 4.3% from 4.1% in June, marking its fourth consecutive month of increase. However, a surge in temporary layoffs and labor force re-entrants appeared to fuel the July increase in the number of unemployed persons. Trusted Insights for What’s Ahead®: Figure 1. Nonfarm payroll gains moderate, remain at healthy level Payroll gains moderate to 6-month low point in July Payroll growth showed further moderation in July and gains continued to be driven by select sectors including healthcare, construction, and government. Payrolls grew by 114,000 in July, declining from June’s report. However, June’s initial estimate of 206,000 additions was downwardly revised by 27,000 to 179,000, bringing the Q2 average down to 168,000 relative to Q1’s 267,000. Monthly job growth now clearly indicates a downward trend since the start of 2024. Figure 2. Employment has returned to pre-pandemic trend Select industries continued to lead job gains, including healthcare and social assistance (+64,000), construction (+25,000), government (+17,000), and transportation and warehousing (+14,000). The information sector continued to face challenges, losing 20,000 workers in July. Food and accommodation added 25,600 workers, continuing steady increases in recent months in the volatile leisure and hospitality sector. However, the gain in leisure and hospitality was partially offset by a loss of 3,100 in arts and entertainment. Other industries showed little change in employment over the month. Figure 3. Select industries continued to drive payroll additions Unemployment rate jumps to 4.3% The unemployment rate rose in July, driven largely by temporary layoffs and re-entrants. The unemployment rate jumped in July to 4.3% from 4.1% in June, recording its fourth consecutive month of increase. The number of unemployed people increased by 352,000 to 7.2 million. A year earlier, the unemployment rate stood at 3.5% with 5.9 million unemployed. Figure 4. Unemployment rate ticked up in July, remains near historical lows However, as Figure 5 shows, much of the jump in unemployment appeared to be driven by temporary layoffs, which increased by 250,000 or 31% in July on a seasonally adjusted basis, while the number of job leavers (i.e., quits) increased by 103,000 or 14% over the month (not reflecting in June’s JOLTS). Labor market re-entrants continued to flow into the unemployed pool, contributing 66,000 to the July increase for an average of roughly 80,000 over the past 3 months. Permanent job losers grew in July by only 36,000, indicating that the rise in unemployment may not be as severe as the headline suggests. Figure 5. Temporary layoffs and labor force re-entrants driving unemployment The unemployment rate is rising even though real GDP growth was solid in Q2 both on a quarterly annualized and year-over-year basis. However, the unemployment rate may not rise much further and may continue to signal a healthy labor market. This is because retirements are causing many companies to hoard workers, keeping the number of layoffs, and thereby unemployment levels, at a minimum. Labor force and average hours holding steady The labor force participation rate was little changed at 62.7% in July, while the rate for workers aged 16-64 held at 75%. The Household Survey showed that 420,000 people were added to the labor force, reflecting an increase in employed workers (+67,000) and those actively looking for work (+352,000). Nonetheless, the overall participation rate remains well below the 63.3% rate in February 2020 just before the pandemic. Population aging is driving that trend, as participation for those 65 and older was 19.8% in July and below pre-pandemic levels, while those aged 16-64 are participating at higher rates. Figure 6. Labor force participation trends driven by aging Prime-aged men have driven the strength in overall labor force participation rate, rising to 89.6% in July, marking the highest rate since 2009 (Figure 7). Women’s participation has also increased since the middle of 2023, ticking up in July to 78.1%, and matching the all-time high achieved in May 2024. Figure 7. Prime-age labor force participation elevated for both men and women Average hours worked—a key bellwether of labor market weakness—had largely held steady in recent months roughly on par to pre-pandemic levels. In July, average hours declined slightly to 34.2. That matched the readings in January and in Mar-Apr 2020 – but historically that would mark the lowest average hours going back to 2011. The majority of companies continue to retain their employees and have not yet reduced hours in the face of rising labor costs and ongoing shortage challenges. Nonetheless, hours worked should be closely watched as companies may cut hours to manage rising labor costs, signaling market duress and potential future layoffs. Figure 8. Average hours worked remain stable Openings more persistent than forecasts in June; hiring and quits remain low Job openings remained unchanged at 8.1 million in June according to JOLTS data released this week. While overall openings have fallen dramatically from the record 12.2 million in early 2022, they remain roughly 1 million higher than in 2019, and remain elevated across a number of sectors. The sectors leading monthly job gains continue to have elevated demand for workers, including healthcare (1.6 million) and government (1.0 million). Openings in transportation and warehousing, wholesale trade, and retail are also on an uptrend in recent months. Figure 9. Job openings persistent at 8 million Unmet labor demand has contributed to slowing labor market churn. The overall hiring rate was 3.4% in June—the lowest since 2014 if excluding Mar-Apr 2020. Hiring has fallen steeply in leisure and hospitality, while moderating in most other sectors. Meanwhile, quits rates remained around prepandemic levels throughout 2024, but are slowly trending downward. Layoffs also remain subdued, falling in June to 1.5 million from 1.7 million in May. This indicates that businesses are still holding on to workers even amid concerns about slowing in the broader economy. Given the elevated level of job openings and acute shortages in certain sectors and geographies, companies may be weary of reducing headcount at the risk of challenges expanding once conditions change. Most sectors have made up for the losses in workers during the pandemic, so many hires now are either incremental to maintain appropriate levels and/or due to labor shortages, especially among sectors requiring in-person workers. The ongoing retreat in the JOLTs job opening aggregate supports this view. The Conference Board Survey of CEO Confidence for the US reveals that, over the next year most CEOs plan to hire or retain workers. Importantly, most CEOs of large firms are not portending layoffs The Fed’s preferred wage measure cools in 2Q The Establishment Survey showed average hourly earnings for private-sector workers moderated to a 3.6% year-over-year increase in July, while the ECI measure for Q2 of private-sector wages and salaries showed a 4.0% annual rise. Both key indicators have reached their lowest annual growth rates since mid-2021. The ECI is the Fed’s preferred wage growth measure as it separates wages and salaries from benefits, and accounts for compositional effects of occupations and industries. Overall ECI compensation for all civilian workers rose an annualized 3.7% in 2Q, after jumping to its highest quarterly increase in a year in Q1 of 4.8% annualized. Figure 10. Employment Cost Index shows broad cooling The slowdown was broad across industries, including outright quarterly declines in compensation in construction (-1.2% annualized), information (-0.8%), and wholesale trade (-0.2%). Overall, goods-producing industries, wages and salaries grew an annualized 1.0% in the 2Q, the slowest since 2009. That was led by construction, where wages and salaries registered their largest quarterly decline on record at -3.2% in the series going back to 2003. Over the last 12 months, the service sector has shown more sustained ECI growth than in goods industries. Year-over-year compensation in private-sector services has advanced 4.0%, versus 3.5% for goods industries. Industries within services continued to see elevated annual compensation growth led by transportation and warehousing (7.7%), other services (5.0%), education and health (4.4%). Another group of service industries have seen faster cooling in wage pressures, with year-over-year compensation growth in leisure and hospitality now at 3.6%, retail to 3.1%, and information to 2.0%. While ECI wages and salaries show service industries growing faster than goods industries over the past 12 months, average hourly earnings suggest the opposite, with goods gaining 4.5% year-over-year while services have grown only 3.4%. This difference could be because the payrolls report is not capturing salaried workers. Figure 11. Wage divergence grows between private-sector and government workers Wage gains also show divergences between private sector and government jobs, and for union workers. While ECI total compensation for private workers overall has grown 3.9% year-over-year and on a downtrend, state and local workers’ compensation advanced 5.0% and has held steady at elevated levels in recent quarters (Figure 12). Average wages and salaries for union workers are growing at a rapid pace of over 6.5% versus a year ago, relative to 3.8% for non-union workers. The divergence reflects union contracts going into effect as pay catches up after lagging non-union workers through 2022. Figure 12. Union pay playing catch-up to other workers
Report Highlights:
Members of The Conference Board get exclusive access to Trusted Insights for What’s Ahead® through publications, Conferences and events, webcasts, podcasts, data & analysis, and Member Communities.
March Payrolls: The Calm Before the Tariff Storm
April 04, 2025
February Jobs Report Hints at Growing Uncertainty
March 07, 2025
Stability Underneath January’s Noisy Jobs Report
February 07, 2025
Q4 ECI Wage Deceleration Slows
February 07, 2025
Robust Job Gains Close 2024
January 10, 2025
November Job Gains Rebound from Disruptions
December 06, 2024

