
July spending and inflation data consistent with rate cuts
30 Aug. 2024 | Comments (0)
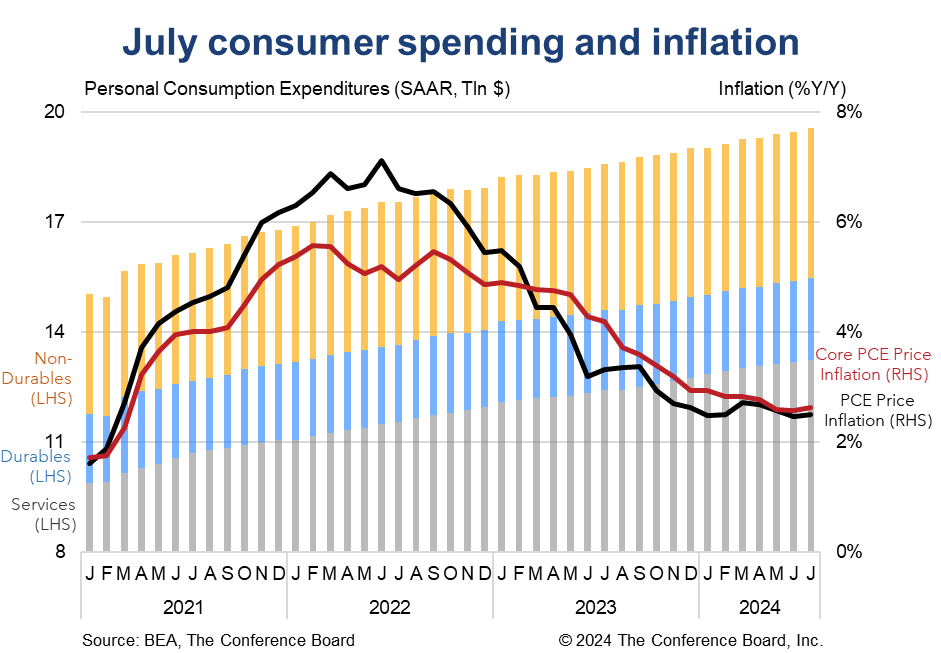
Real consumer spending rose in July and inflation readings pointed to a gradual convergence to the Fed’s 2% target. Real disposable personal income growth grew modestly in the month, but savings rates remained very low, and interest payments on debt as a share of income remained elevated. Spending data at the onset of Q3 have been strong, but we remain concerned about the sustainability of this trend. Inflation data for July were consistent with the gradual deflationary narrative that has held over the course of the summer. We continue to expect the Fed to start cutting interest rates in September.
Trusted Insights for What’s Ahead®
- The Fed should be pleased with much of the details of today’s report. We continue to forecast a 25 bps rate cut in September, followed by two additional 25 bps cuts in November and December.
- The Fed’s preferred inflation gauges were little changed from the June report. However, these numbers are consistent with a gradual convergence to the Fed’s 2% inflation target sometime in mid-2025.
- Consumer spending rose at the start of Q3, but income growth was tepid and household savings and debt remain concerning. We continue to forecast a slowdown in consumer spending in H2 2024.
- The Fed may also be concerned about the clear rotation in spending away from wants towards needs that are likely being financed with debt.
Report Highlights
Spending Details
Personal consumption expenditures rose by 0.5% m/m (in nominal terms) in July, vs. 0.3% m/m percent in June. Spending on services rose by 0.4% m/m while spending on goods rose by 0.7% m/m. However, after accounting for inflation, real consumer spending was up 0.4% m/m in July with spending on services rising 0.2% m/m and spending on goods rising 0.7% m/m.
Inflation Details
Headline PCE prices rose by 2.5% y/y in July, vs. 2.5% y/y in June, and core PCE price inflation (which excludes food and energy) rose by 2.6% y/y, vs. 2.6% y/y in June. On a month-over-month basis, headline PCE inflation rose by 0.16%, vs. 0.06% in June, and core PCE inflation rose by 0.16%, vs. 0.16% in June. Prices for goods were flat in the month, but services rose 0.25% m/m. Food prices rose 0.17% m/m and energy prices were flat.
Income Details
Overall personal income rose by 0.3% m/m (in nominal terms) in July, vs. 0.2% m/m in June. When factoring in inflation, the real month-over-month growth rate was 0.2% m/m. In year-over-year terms, real personal income rose 1.9% in July, vs. 1.9% in June. Meanwhile, real disposable personal income (which is personal income less taxes) rose by 0.1% m/m, vs. up 0.1% m/m in June. Finally, the personal savings rate fell to just 2.9% of disposable personal income, vs. an average of 7.4% in 2019.
Interest Payment Details
Nominal personal interest payments (PIP), which represent nonmortgage interest paid by households, fell by 0.2% m/m in July, vs. an increase of 1.0% m/m in June. In year-over-year terms these payments are up 6.5% (vs. a peak of 66.5% y/y in June 2023). Consumer’s increased reliance on debt, and specifically credit card debt, and the surge in interest rates over the last two years are responsible for these gains. As of July, PIP accounted for 2.6% of overall Disposable Personal Income, vs. an average of 2.1% in 2019.
-
About the Author:Erik Lundh
Erik Lundh is Senior Global Economist for The Conference Board Economy, Strategy & Finance Center, where he focuses on monitoring global economic developments and overseeing the organization&rsquo…


0 Comment Comment Policy