
Loading...
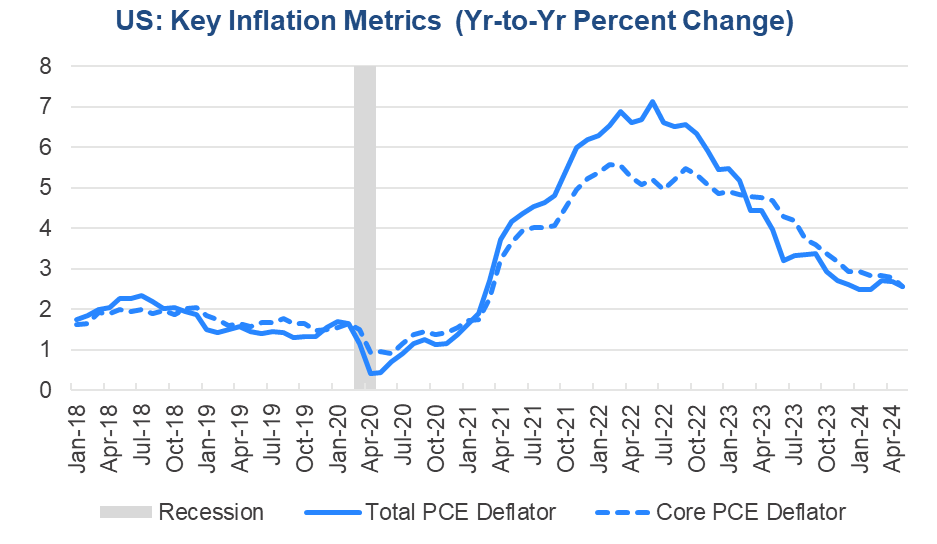
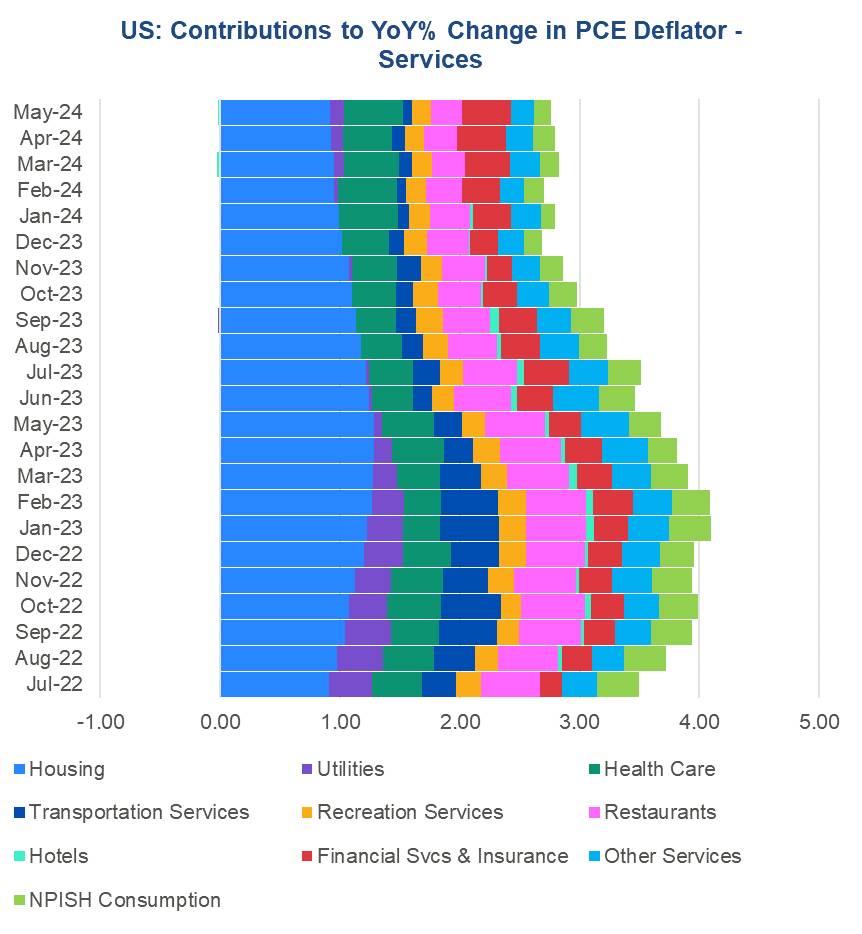
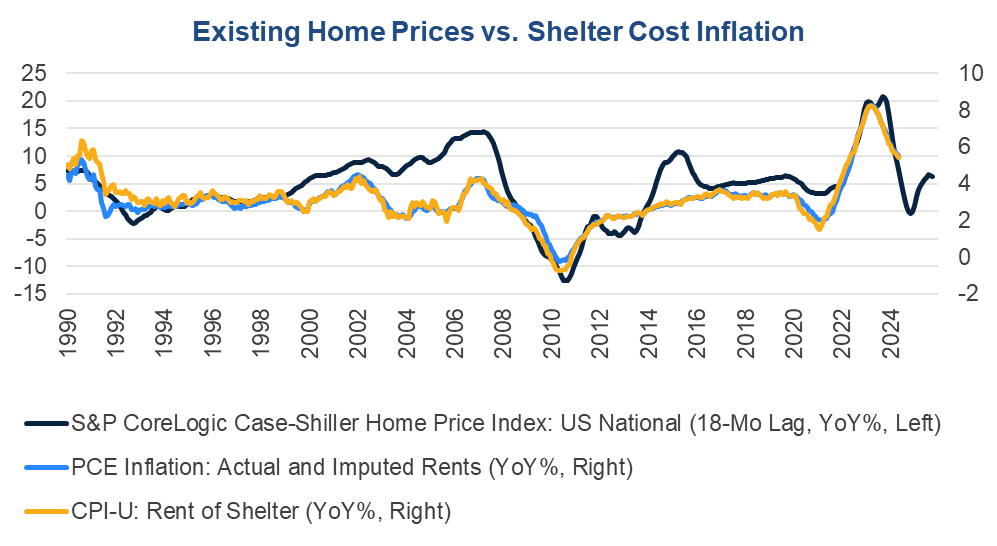
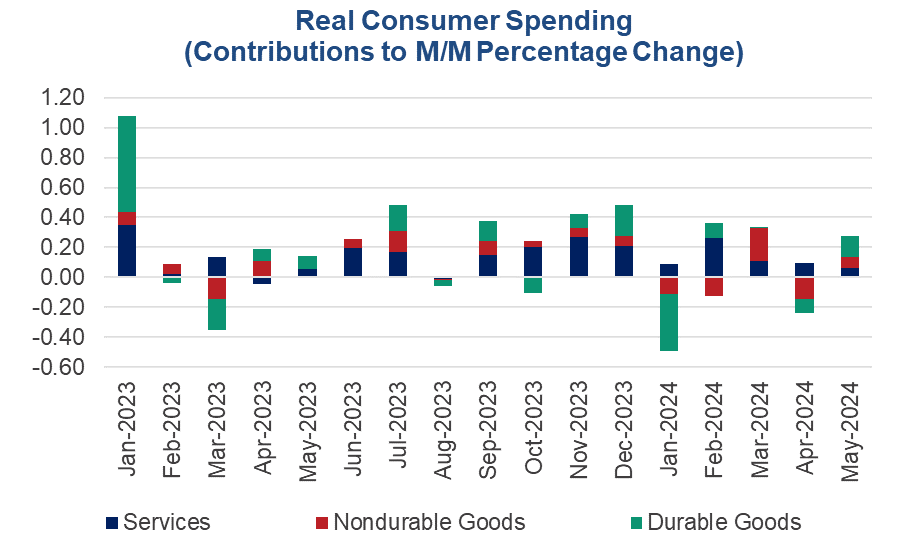
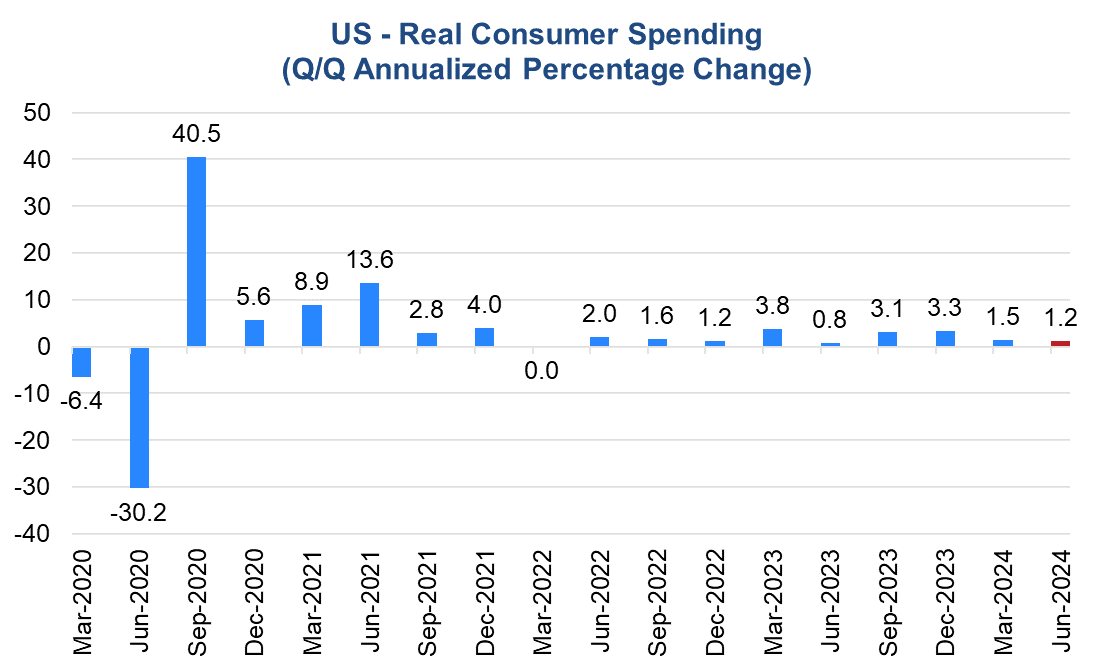
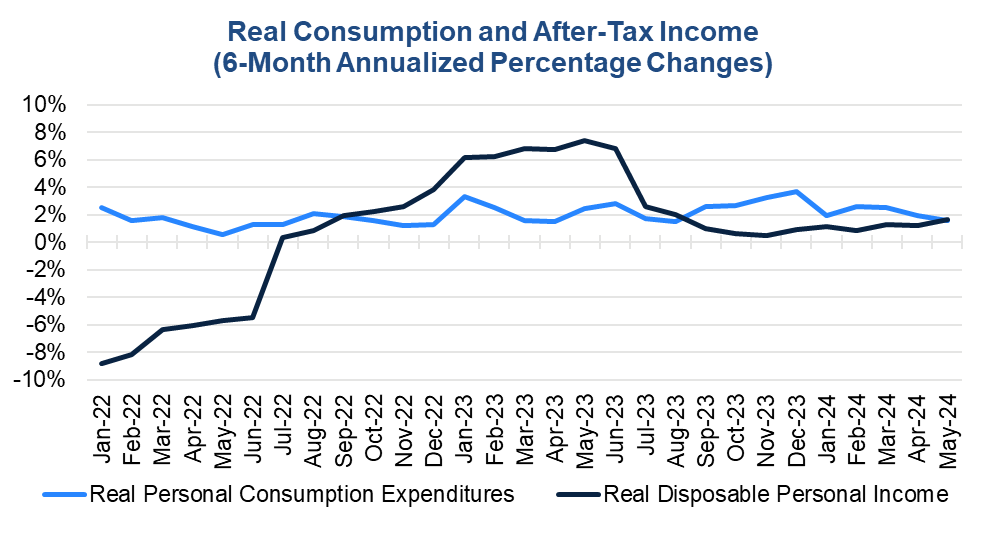
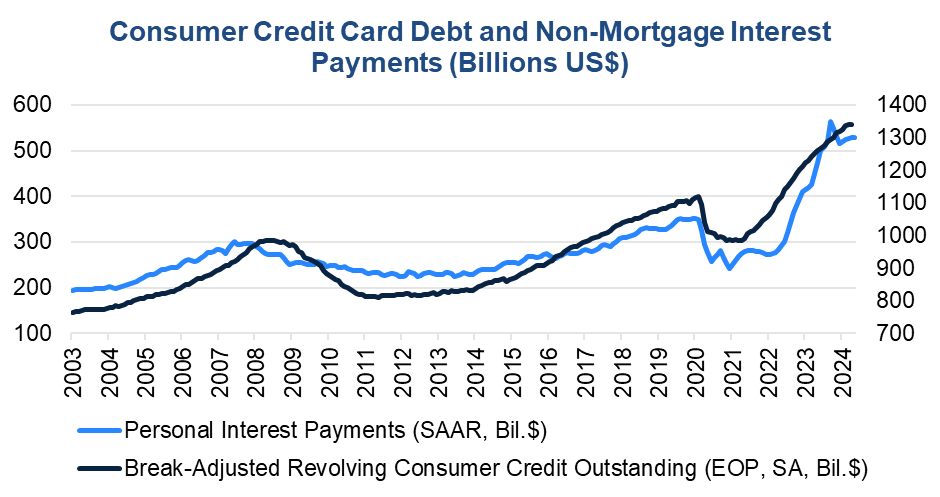
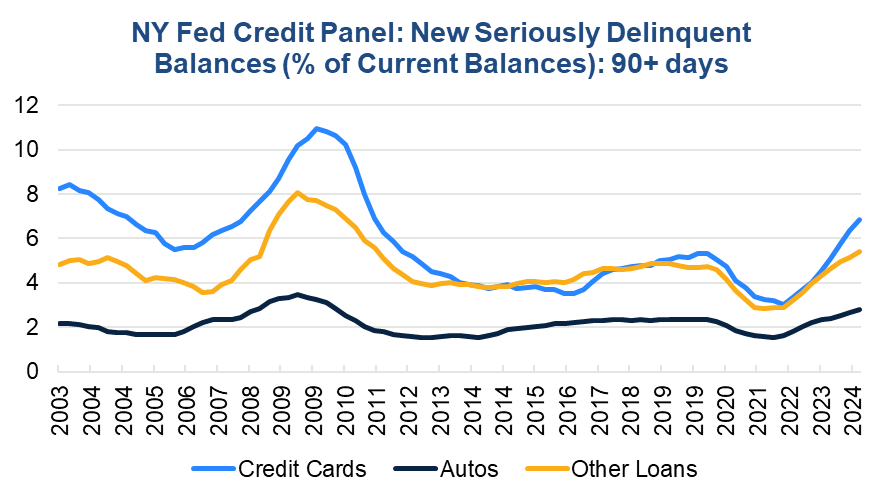
Consumer spending and inflation cooled in May, consistent with the Fed’s plan to drive inflation back to its 2-percent target. Spending picked up in both nominal and real terms in May. However, at a slower year-over-year pace, real consumption is better matching overall real income growth. Moreover, Q2 real consumer spending growth is tracking at 1.2 percent annualized, compared to 1.5 percent annualized in Q1. Total and core personal consumption expenditure (PCE) inflation slowed month-over-month and year-over-year in May following sticky readings in the first few months of this year. Services inflation continues to drive overall inflation as prices for goods are offsetting. Still, consumers are experiencing rising interest costs as households are supplementing subdued real after-tax income growth with debt. Trusted Insights for What’s Ahead® Figure 1. Total and core PCE inflation continued to cool after of period of stickiness Sources: Bureau of Economic Analysis and The Conference Board. Inflation, as measured by the PCE deflator continued to cool in May, consistent with the Fed’s desire to return this measure of consumer prices to its 2-percent target. On a month-over-month basis, total inflation was unchanged at 0.0 percent in May after rising by 0.3 percent in April. On a year-over-year basis total inflation slowed from 2.7 percent in April to 2.6 percent in May. Core inflation, which excludes volatile food and energy components, rose by 0.2 percent in May after a 0.3 percent increase in April. Core inflation eased from 2.8 year-over-year in April percent to 2.6 percent year-over-year in May. Services still driving annual inflation Overall, inflation continues to be driven by services inflation as costs for goods are offsetting themselves. Nondurable goods prices for items including groceries and gasoline are still rising compared to a year ago, but durable goods prices for items like vehicles, furniture, and recreational goods are falling (Figure 2). Meanwhile, services inflation continues to be driven higher by shelter and insurance costs, and persistent labor shortages (Figure 3). Past slowing in home prices suggest that shelter costs should continue to moderate over the course of this year (Figure 4). However, rising insurance premiums are increasing financial and insurance costs with no end in sight. More high-tech features in motor vehicles are driving motor vehicle insurance costs higher, while natural disasters are bloating home insurance premiums. Labor shortages, and the elevated wages firms are deploying to combat them, are keeping prices for restaurants and recreation sticky. The cost of health care, especially as the population ages, is also fueling services inflation. Figure 2. Nondurable and durable goods inflation offsetting each other Sources: Bureau of Economic Analysis and The Conference Board. Figure 3. Services still driving consumer price inflation Sources: Bureau of Economic Analysis and The Conference Board. Figure 4. Shelter cost inflation should continue to slow over rest of 2024 Sources: Standard & Poor’s, Bureau of Labor Statistics, Bureau of Economic Analysis, and The Conference Board. Nominal Spending rebounded in May Nominal consumer spending rose by 0.3 percent month-over-month in May after a modest 0.1 percent increase in April. Rebounds in durable and nondurable spending and a healthy gain in services boosted nominal spending in the month. After adjusting for inflation, real consumer spending rose by 0.3 percent month-over-month in May after declining by 0.1 percent in April. Q2 Real consumer spending tracking slower than Q1 Real spending gains were led by a recovery in durable goods spending on most items (Figure 5), except for motor vehicles, which was down in the month. For nondurable goods, consumers also spent more on most items, except for food and beverages. Real services growth was driven by an increase in consumption of transportation services. Over the April-May span real consumer spending rose by 1.2 percent annualized, compared to 1.5 percent annualized in Q1 (Figure 6). This tracking is better than our current projection for spending in Q2 but is still consistent with our narrative of continued moderation in the household spending and consequently the US economy. Figure 5. Real Goods spending bounced back in May Sources: Bureau of Economic Analysis and The Conference Board. Figure 6. Real Q2 consumer spending growth tracking lower than Q1 consumption Sources: Bureau of Economic Analysis and The Conference Board. Real spending more consistent with overall real income growth Nominal personal income grew by 0.5 percent month-over-month in May following a 0.3 percent increase in April. Higher wages and salaries helped drive much of the gains, but increases were also present for rental, asset, and transfers income. Proprietors’ income was flat in the month. Real personal income rose by 0.5 percent in May after failing to grow in April and was up 2.0 percent compared to a year ago. On balance, total real consumer spending is tracking better in-line with overall real income growth (Figure 7). Figure 7. Real spending tracking better in line with real income Sources: Bureau of Economic Analysis and The Conference Board. Flagging after-tax income growth bodes poorly for household finances Real disposable income, defined as income after paying taxes, also rose by 0.5 percent in the month. But at 1.1 percent year-over-year in May 2024 remained subdued compared to the 5.0 percent year-over-year pace reported in May of 2023. Weaker real after-tax income is prompting consumers to take on more debt amid a period of high interest rates. Indeed, interest costs associated with this debt has skyrocketed (Figure 8) and extreme delinquencies (i.e., lateness in payments exceeding 90 days) remain elevated compared to pre-pandemic norms (Figure 9). This needs to be closely watched to ensure that consumers do not slip into crisis mode, one of many risks that could spark a recession. Figure 8. Consumers still facing rising debt service with credit use Sources: Bureau of Economic Analysis and The Conference Board. Figure 9. Consumer credit delinquencies remain elevated Sources: FRBNY Consumer Credit Panel/Equifax and The Conference Board.
Report Highlights
Consumer price inflation continued to cool in May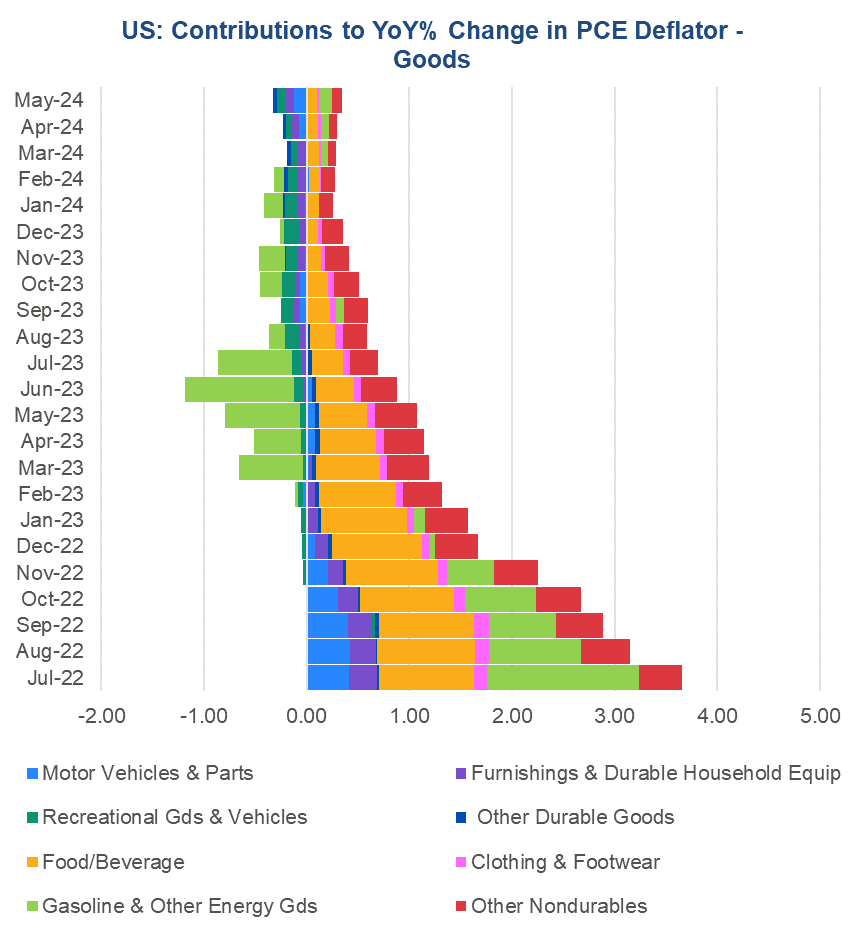
Members of The Conference Board get exclusive access to Trusted Insights for What’s Ahead® through publications, Conferences and events, webcasts, podcasts, data & analysis, and Member Communities.
Retail Sales Show Consumers Stock Up ahead of Tariffs
April 16, 2025
US Seeks Shipbuilding Revival, Muting of China Dominance
April 14, 2025
March CPI May Hint at Consumer Pullback as Tariffs Rise
April 10, 2025
The US-China Trade War Escalates
April 09, 2025

