-
Email
Linkedin
Facebook
Twitter
Copy Link

Loading...
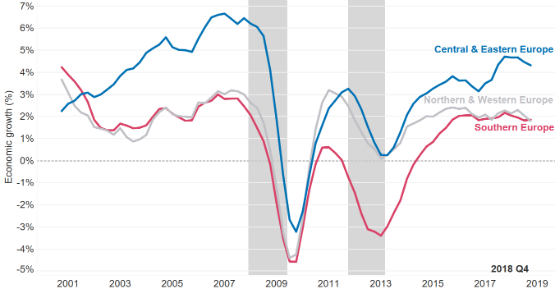
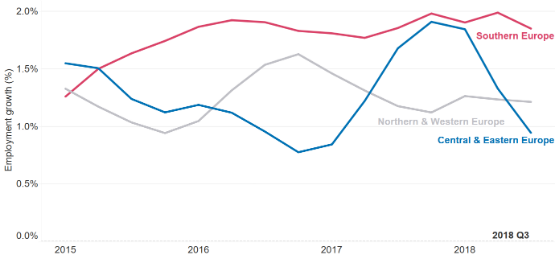
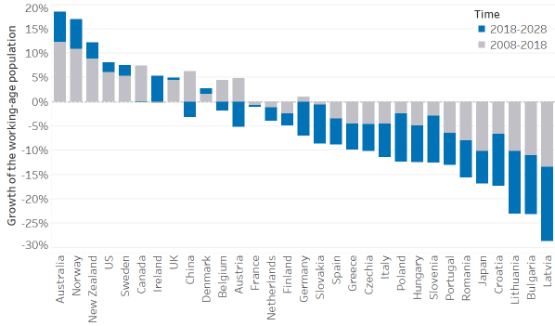
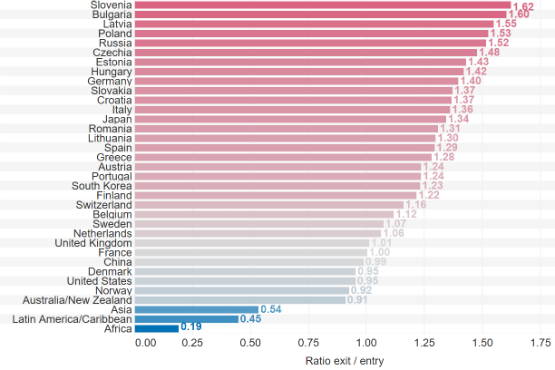
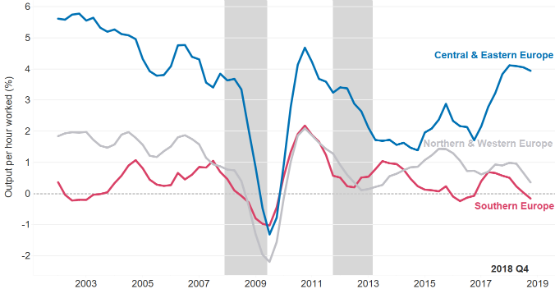
In our previous blog on Central and Eastern Europe (CEE), we showed the severe tightness in its labor market and how real wages have strongly accelerated over the past two years. In this blog, we will discuss why labor markets in CEE have become so tight and what implications business leaders and policy makers should be aware of. In this blog, we have divided Europe into the following three regions. Central and Eastern Europe (CEE) consists of Bulgaria, Croatia, Czechia, Estonia, Hungary, Lithuania, Latvia, Poland, Romania, Slovenia, and Slovakia. Northern and Western Europe (NWE) consists of Austria, Belgium, Denmark, Finland, France, Germany, Ireland, the Netherlands, Norway, the UK, and Sweden. Southern Europe (South 4) consists of Greece, Italy, Portugal, and Spain. For the labor market indicators shown in this blog, the regions are weighted according to each country’s share in real GDP. Why do we see such a tight labor market in CEE? CEE has especially benefited from the recovery of the Euro Area: Economic growth accelerated to around 4 percent in 2016 (Chart 1), showing the strong demand for CEE goods and services since the Euro Area recession ended in early 2013. In the last 2 years the region has further accelerated. Chart 1: Economic growth, 4-quarter moving average, 2000Q1 to 2018Q4. Note: Due to missing data, the UK, Croatia, and Italy are not included in the regional averages for 2018Q4. Source: Eurostat. While demand is strong, labor supply is shrinking: Even though demand is strong, an especially tight labor market has made it harder for businesses to hire. As a result, employment growth has started to slow down since the end of 2017 (Chart 2). Part of the labor market tightness can be explained by the current stage of the business cycle—after a 5-year expansion we would expect labor markets to be tighter. At the same time, the current labor market situation in CEE has been intensified by CEEs terrible demographic trends— a fast aging workforce and net outward migration. Chart 2: Employment growth, 2000Q1 to 2018Q3. Note: Employment is based on labor force survey data. Source: Eurostat. An aging workforce—Chart 3 shows the 5-year growth rates of the working-age population from 2008 to 2028 in which both natural population growth and migration are included. The grey bars illustrate that the working-age population shrank in CEE countries in the last decade. In the next 10 years these trends are only going to accelerate further as is depicted by the blue bars. Especially Lithuania, Latvia, Bulgaria, and Romania will have a much smaller share of the population available to work. Chart 3: Working-age population (20-64) log growth rate, 2008 to 2028. Source: Eurostat, calculations by The Conference Board—actual population estimates up to 2017, baseline population projections from 2018 onwards. The demographic slowdown is mostly caused by the large baby-boomer cohort that is now retiring and the smaller size of the generation that will take their place. Chart 4 shows the ratio of people aged 60-64 to 15-19—the people who will exit and enter the working-age population between 2018 and 2023. Slovenia, Bulgaria, and Latvia have the highest exit/entry ratio in the world. The demographic slowdown in CEE countries is much more severe compared to most countries in NWE. Note that compared to almost all European countries, the demographic trend in the US is quite favorable. Chart 4: The ratio of people aged 60-64 to 15-19, 2018. Note: 2018 is projected. Source: United Nations World Population Prospects 2017. Net outward migration—While aging is the main driver of the shrinking workforce, net outward migration in most CEE countries is also contributing to the demographic declines. Chart 5 shows the net migration flows from 2013 to 2016 as a percent of the population, distinguishing between nationals and other EU citizens moving in or out of the country. Especially in Latvia and Lithuania, many nationals left the country after the Great Recession. From 2013 to 2016 [1], these two countries saw an outflow of about 2.5 percent of their population. Romania, Croatia, and Poland have less but still a considerable outflow of people with 0.5 to 1.5 percent of the population. Chart 5: Net migration flows as a percent of the total population, sum of the period 2013-2016. Note: Net migration as a percent of the population, summing up 2013 to 2016. Non-EU citizens were excluded from the analysis. Source: Eurostat. What does the loss of CEE workers mean for business in 2019 and beyond? Chart 6: Output per hour worked, 4-quarter moving average, 2002Q1 to 2018Q4. Note: Because of missing data, Belgium is not included in the NWE weighted average. 2018Q4 is not available for Italy and Croatia. Source: Eurostat, calculations by The Conference Board. [2] To learn more about the economic outlook for Central and Eastern Europe, read The Conference Board Economic Outlook for Europe.

[1] Migration data by citizenship is only available from 2013 onwards.
March Payrolls: The Calm Before the Tariff Storm
April 04, 2025
February Jobs Report Hints at Growing Uncertainty
March 07, 2025
Q4 ECI Wage Deceleration Slows
February 07, 2025
Stability Underneath January’s Noisy Jobs Report
February 07, 2025
Robust Job Gains Close 2024
January 10, 2025
November Job Gains Rebound from Disruptions
December 06, 2024
Charts
Wage inequality continues downward trend in quarter 2 of 2023
LEARN MORECharts
Recent hikes in quits rates indicate retention difficulties across all industries, but have nearly approached pre-pandemic levels
LEARN MORECharts
Decline in office and administrative support work suggests certain tasks and skills have been replaced by automation
LEARN MORECharts
CEOs are having trouble filling positions as the unemployment rate drops lower
LEARN MORECharts
Non-union wages are growing faster than union wages
LEARN MORECharts
This index identifies the risk of future labor shortages for specific occupations.
LEARN MORECharts
Labor shortages and the tightening of labor markets have led companies to lower education requirements when recruiting.
LEARN MORECharts
The rapid rise in job openings to historic highs coupled with increasingly more workers quitting is leading to severe labor shortages, especially in leisure & hospita…
LEARN MORECharts
There has been a large increase in the share of office job ads that mention remote work since before the pandemic.
LEARN MOREPRESS RELEASE
Employment Trends Index™ (ETI) Increased in August
September 09, 2024
PRESS RELEASE
Why the World Is Running Out of Workers
August 13, 2024
PRESS RELEASE
Employment Trends Index™ (ETI) Decreased in July
August 05, 2024
PRESS RELEASE
Employment Trends Index™ (ETI) Decreased in June
July 08, 2024
PRESS RELEASE
Employment Trends Index™ (ETI) Decreased in June
July 10, 2023
PRESS RELEASE
Employment Trends Index™ (ETI) Decreased in May
June 05, 2023
