The Conference Board publishes leading, coincident, and lagging indexes designed to signal peaks and troughs in the business cycle for major economies around the world.
The Conference Board Leading Economic Index® (LEI) for the US Declined in June and Partially Reversed Gains from Prior Two Months
Latest Press Release
Updated: Monday, July 20, 2026
Using the Composite Indexes: The Leading Economic Index (LEI) provides an early indication of significant turning points in the business cycle and where the economy is heading in the near term. The Coincident Economic Index (CEI) provides an indication of the current state of the economy. Additional details are below.
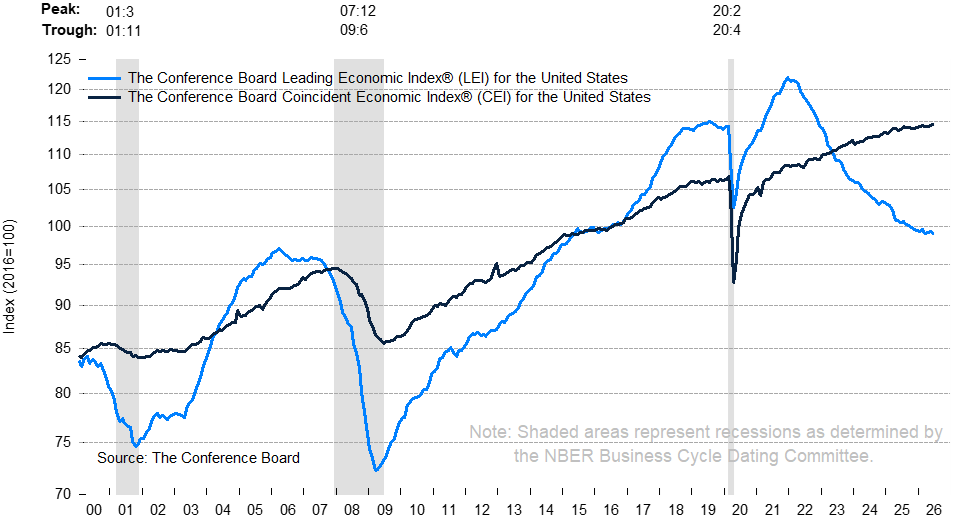
The Conference Board Leading Economic Index® (LEI) for the US declined by 0.2% in June 2026 to 99.1 (2016=100), following a 0.1% increase in May. However, the LEI is down by only 0.3% over the first half of 2026, a much smaller rate of decline than its 1.1% contraction over the second half of 2025.
“In June, the Leading Economic Index (LEI) for the US declined and partially reversed gains registered in May and April,” said Justyna Zabinska-La Monica, Senior Manager, Business Cycle Indicators, at The Conference Board. “While some components of the LEI were little changed, the largest positive contribution from the yield spread, followed by marginal positive input from the remaining financial components, were not enough to offset weak consumer expectations and a drop in building permits across most of its categories. Despite the recent decline, the LEI’s six- and twelve-month growth rates, while negative, were stable. Consumer spending is weakening, but strong business investment related to AI is expected to support economic activity while inflation continues to improve. The Conference Board raised its forecast from 1.8% to 1.9% y/y GDP growth for 2026.”
The Conference Board Coincident Economic Index® (CEI) for the US increased by 0.2% in June 2026 to 114.6 (2016=100), after a similar increase of 0.2% in May. Overall, the CEI expanded by 0.4% over H1 2026, slightly more than the 0.3% growth rate over the previous six months. The CEI’s four component indicators—payroll employment, personal income less transfer payments, manufacturing and trade sales, and industrial production—are included among the data used to determine recessions in the US. All components of the CEI made positive contributions in June.
The Conference Board Lagging Economic Index® (LAG) for the US was unchanged at 120.5 (2016=100) in June 2026, after a 0.1% decline in May. However, the LAG’s six-month change was firmly in positive territory at 1.1% growth over the first half of this year, reversing a decline of 0.1% over the second half of 2025.
The US LEI declined in June after two consecutive increases
Positive financial components were more than offset by weakness in consumer expectations and a drop in building permits

The LEI’s six-month growth while negative, remained stable

NOTE: The chart illustrates the so-called 3Ds—duration, depth, and diffusion—for interpreting a downward movement in the LEI. Duration refers to how long the decline has lasted. Depth denotes the size of decline. Duration and depth are measured by the rate of change of the index over the most recent six months at an annualized rate. Diffusion is a measure of how widespread the decline is among the LEI’s component indicators—on a scale of 0 to 100, a diffusion index reading below 50 indicates most components are weakening.
The 3Ds rule signals an impending recession when: 1) the six-month diffusion index lies at or below 50, shown by the black warning signal lines in the chart; and 2) the LEI’s six-month growth rate (annualized) falls below the threshold of −4.3%. The red recession signal lines indicate months when both criteria are met simultaneously—and thus that a recession is likely imminent or underway.
Summary Table of Composite Economic Indexes

About The Conference Board Leading Economic Index® (LEI) and Coincident Economic Index® (CEI) for the US
The composite economic indexes are key elements in an analytic system designed to signal peaks and troughs in the business cycle. Comprised of multiple independent indicators, the indexes are constructed to summarize and reveal common turning points in the economy in a clearer and more convincing manner than any individual component.
The CEI reflects current economic conditions and is highly correlated with real GDP. The LEI is a predictive tool that anticipates—or “leads”—turning points in the business cycle by around seven months.
The ten components of the Leading Economic Index® for the US are:
- Average weekly hours in manufacturing
- Average weekly initial claims for unemployment insurance
- Manufacturers’ new orders for consumer goods and materials
- ISM® Index of New Orders
- Manufacturers’ new orders for nondefense capital goods excluding aircraft orders
- Building permits for new private housing units
- S&P 500® Index of Stock Prices
- Leading Credit Index™
- Interest rate spread (10-year Treasury bonds less federal funds rate)
- Average consumer expectations for business conditions
The four components of the Coincident Economic Index® for the US are:
- Payroll employment
- Personal income less transfer payments
- Manufacturing and trade sales
- Industrial production
To access data, please visit: https://www.conference-board.org/data
About The Conference Board
The Conference Board is the Member-driven think tank that delivers Trusted Insights for What's Ahead®®. Founded in 1916, we are a nonpartisan, not-for-profit organization holding 501 (c) (3) tax-exempt status in the United States. TCB.org l Learn about Membership