
US Economic Growth Cooled in Q1 2024
25 Apr. 2024 | Comments (0)
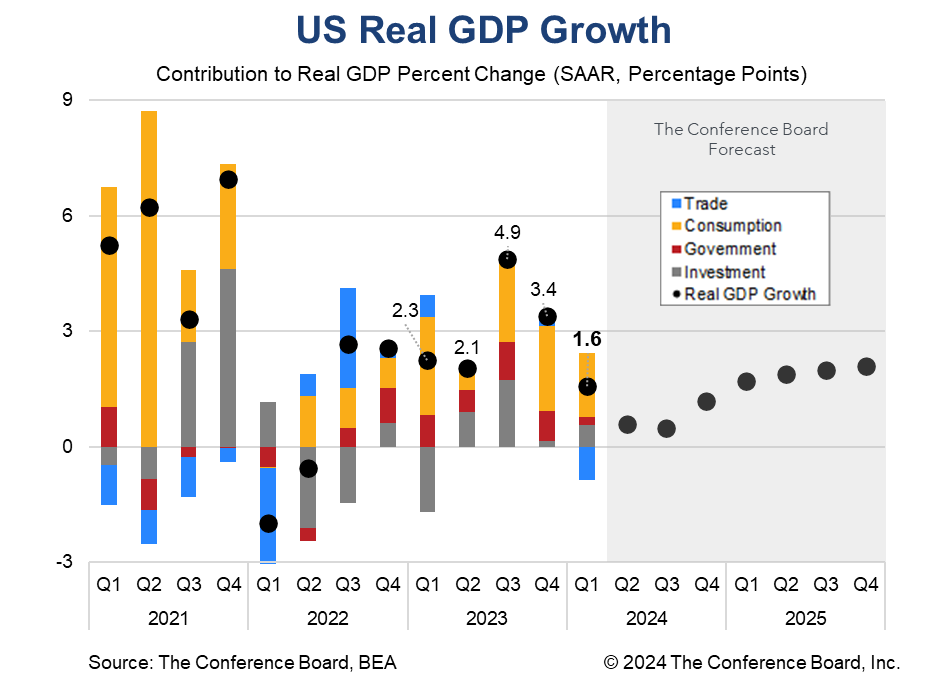
US Real Gross Domestic Product rose by 1.6% (annualized) during the first quarter of 2024, well below the consensus forecast of 2.5%* and The Conference Board’s forecast. While consumption moderated somewhat it remained the primary driver of economic growth in the quarter. Rising imports and falling inventories tempered overall GDP.
Today’s milder report will likely be welcomed by the Fed. Following stronger than expected inflation in Q1 and a labor market that remains hot, these softer GDP numbers show that tight monetary policy is having an impact. However, given recent inflation trends we expect the Fed to delay interest rate cuts further into the year.
KEY TAKEAWAYS FROM TODAY’S REPORT
GDP data from Q1 2024 showed a number of important trends. Consumption growth, while softer, remained the primary economic driver at the onset of the year. The distribution of spending remained uneven, with service spending expanding by 4.0% and goods spending contracting by 0.4%. Real disposable personal income growth cooled to just 1.1%. Coupled with rising debt levels, high interest rates, and modest savings rates we remain concerned about the wherewithal of US consumers.
Investment growth also improved for the quarter, but unevenly. Business investment cooled from Q4 2023 due to weak investment in structures. However, investments in intellectual property and equipment both accelerated. Residential investment growth expanded by 13.9% for the quarter – the largest gain since Q4 2020. High demand and low supply of housing offset elevated interest rates for residential building activity. Finally, private inventories saw a contraction in Q1, which served as a slight drag on overall economic growth.
Today’s data showed worse than expected net exports. Export growth slowed to just 0.9% in Q4 from 5.1% in Q1. Import growth, on the other hand, accelerated to 7.2% from 2.2%. The net effect of these flows resulted in a 0.9 percentage point hit to overall GDP growth. Meanwhile, government spending grew by just 1.2% in Q1 due to softer state a local government spending and a small contraction in federal spending.
THE INDIVIDUAL COMPONENTS OF GDP WERE MIXED.
Personal Consumption Expenditures (PCE) expanded by 2.5% for the quarter, vs. 3.3% in Q4. Demand for goods grew by -0.4% (vs. 3.0 in Q4), while demand for services expanded by 4.0% (vs. 3.4% in Q3). High interest rates are making financing big-ticket goods, like cars, more expensive. Additionally, as we already have monthly spending data for January and February, these quarterly data imply that consumer spending continued to expand in March. We’ll learn more about this in tomorrow’s Personal Income & Outlays report.
On the investment side, nonresidential fixed investment grew by 2.9 percent, vs. 3.7 percent in Q4. Investment in nonresidential structures was roughly flat for the quarter, but equipment and intellectual property product growth accelerated. Residential investment growth popped to 13.9%, vs. 2.8% in Q4. Private inventories contracted by $19 billion.
Government spending was also a contributor to overall economic growth for the quarter, rising 1.2%, vs. 4.6% in Q4. However, the deceleration from the prior quarter was due to slower growth in federal nondefense spending and a contraction in federal defense spending.
Net exports kept overall GDP growth in check, contributing -0.9 percentage point to overall GDP. Exports grew by 0.9% for the quarter while imports grew by an outsized 7.2%.
Inflation intensified at the onset of the year. Relative to the previous quarter, Headline PCE inflation rose to 3.4% in Q1 (vs. 1.8 in Q4 2023) and Core PCE rose to 3.7% (vs. 2.0% in Q4 2023) on an annualized basis. However, in year-on-year terms both cooled somewhat (headline 2.6% and core 2.9%) but remain well above the Fed’s 2% target.
Finally, it is important to note that GDP data have undergone large revisions in recent quarters. For example, the advance estimate for Q1 2023 data was 1.1 percent, but was gradually revised up by more than a full percentage point to 2.2 percent. It is very likely that the final data for Q1 2024 will be different from today’s advance estimates.
* Consensus data from Bloomberg
-
About the Author:Erik Lundh
Erik Lundh is Senior Global Economist for The Conference Board Economy, Strategy & Finance Center, where he focuses on monitoring global economic developments and overseeing the organization&rsquo…


0 Comment Comment Policy