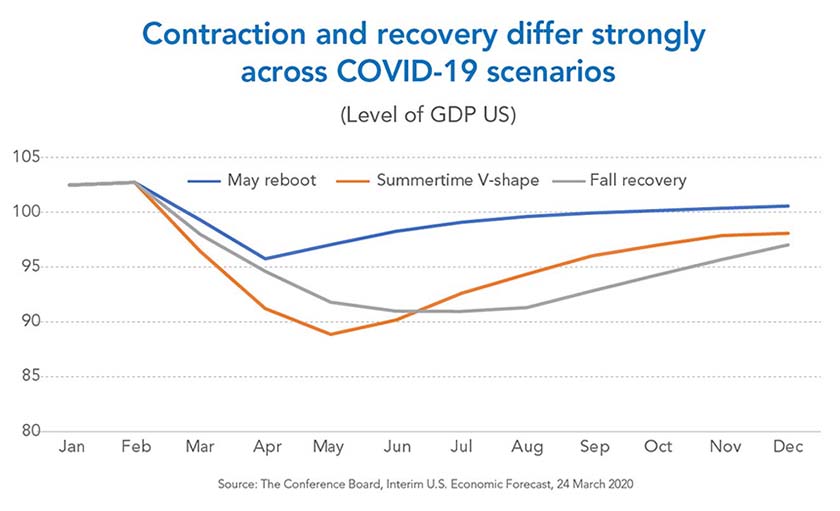
- May reboot (quick recovery): Assuming a peak in new COVID-19 cases for the US as a whole by mid-April (with some possible variation by region), economic activity may gradually resume beginning in May.
- Summertime V-shape (deeper contraction, bigger recovery): The peak in new COVID-19 cases will be higher and delayed until May, creating a larger economic contraction in Q2 but a stronger recovery in Q3 than in the scenario above.
- Fall recovery (extended contraction): Managed control of the outbreak helps to flatten the curve of new COVID-19 cases and stretches the economic impact across Q2 and Q3, with growth resuming by September.
The impact on the economy is different across the three scenarios. In the “May reboot” scenario, GDP growth will shrink by 1.6 percent in 2020 (over 2019). In the “Summertime V-shape” and “Fall recovery” scenarios, the contraction will be much stronger (5.5 percent and 6 percent, respectively). Businesses should prepare for those worst-case scenarios, which have high probability.
| |
About the Scenarios
To build our scenarios, The Conference Board used an industry-based approach which assumes a percentage contraction by major sector and by month. The assumptions will be made available in an interactive format on our website (www.conference-board.org) so that users can alter the assumptions and make their own projections.
|
|


Irrespective of which scenario or variation ultimately plays out, the impact on the unemployment rate will be quite significant. In the “May reboot” scenario, the unemployment rate will go up to 8 percent by Q3 and then gradually drop off during the second half of the year. In the other two scenarios, unemployment may increase to more than 15 percent by Q3, and—especially in the case of the “Fall recovery” scenario—remain at 10 percent or more until the final quarter of the year.
The worst effects on the economy can be mitigated by at least four policy factors:
- A strong and coordinated management of the health crisis itself;
- The use of policy tools to reduce layoffs;
- Fiscal policy tools that reach lower-income consumers and small businesses fast; and
- A cautious but clearly guided reboot of the economy, with a focus on the quick unlocking of supply chains.
Our scenarios in more detail
“May reboot” scenario—quick recovery
Our “May reboot” scenario assumes that the number of new COVID-19 cases added daily will stop accelerating by mid-April. While the number of sick people may continue to increase into May or June, it might then be possible to allow a controlled reboot of the economy by the month of May. Warmer weather might help, and there will hopefully be enough time to discover or develop better medications and treatments (though development of a widely-used vaccine may take longer) to avoid a return of the pandemic during the following fall and winter seasons.
The largest contractions in this quick recovery scenario are in sectors most directly impacted by social distancing and other containment measures. The Arts, Entertainment, Recreation, and Accommodations sector shows the biggest decline at 30 percent per month in March and April. This is followed by Transportation & Warehousing at 15 percent, and Retail Trade at between 7.5 and 15 percent cumulatively for two months. Other sectors such as Manufacturing and Finance & Insurance don’t get away unscathed either, but monthly declines are smaller at 5 to 7.5 percent.
In this quick recovery scenario, the most impacted sectors may slowly resume operations by May. Other sectors in the economy may be only moderately damaged by what will essentially be a six-week economic crisis. Small growth upsides can be expected for Utilities, Information Services, Professional and Scientific Services, Waste Management, and Government, but those will fall far short of making up for the short-term losses in other sectors.
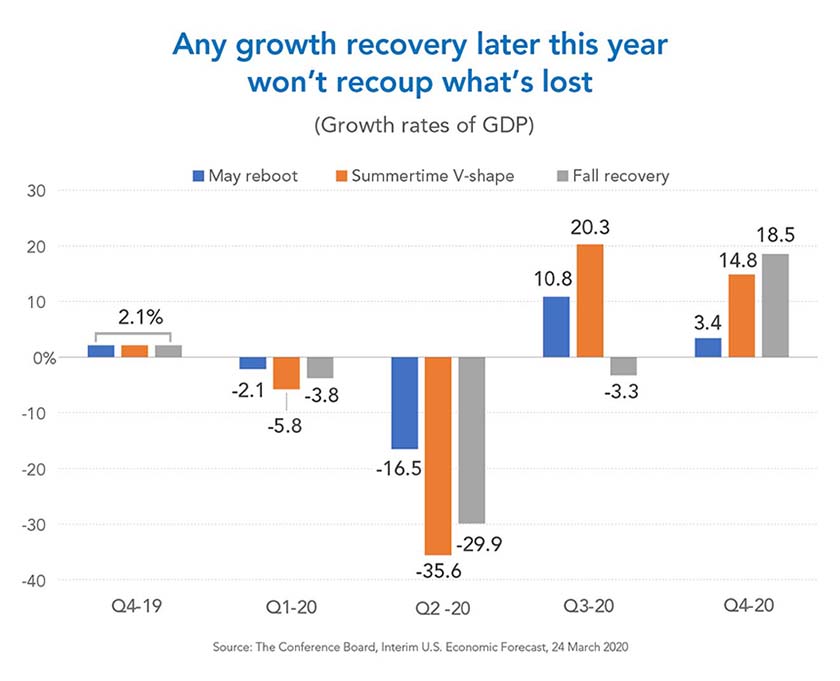
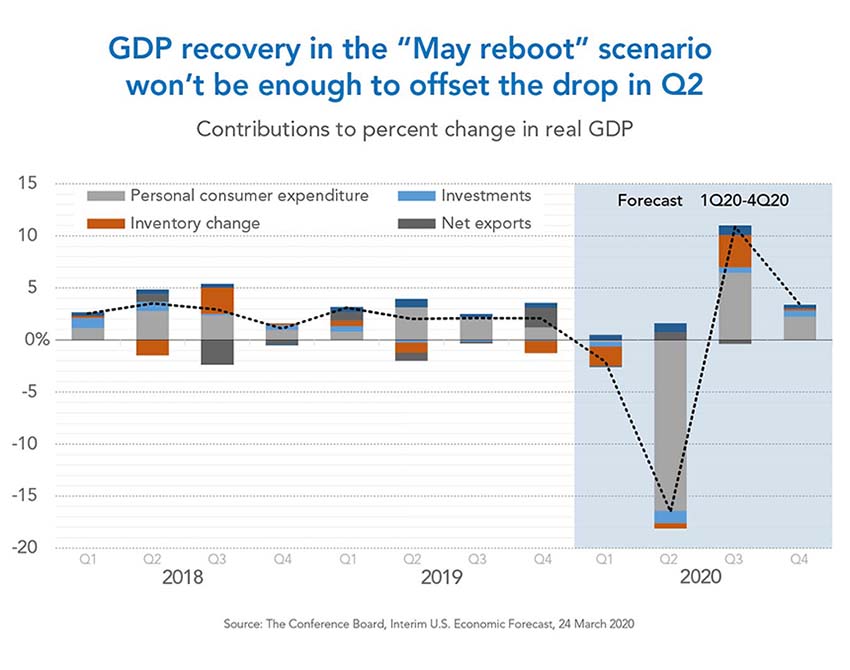
Using an annualized rate, the economy will contract by 16.5 percent in the second quarter which equals a decline in the level of GDP of about 4.5 percent compared to the first quarter. As a recovery emerges in the third and fourth quarters, the annual loss in GDP in 2020 will end at 1.6 percent compared to 2019.

Sectors that depend on discretionary consumer spending the most will suffer the strongest impact from the crisis. On an annualized basis, consumer spending will contract by 22.8 percent in Q2 but recover by 6.4 percent on average during the second half of 2020, a level insufficient to offset the 11.5 percent decline during the first half of the year. For all of 2020, the decline would be 2.5 percent (over 2019). In addition, we assume strong declines in investments, exports, and inventories until the second half of the year. Unemployment will rise to 8 percent by the third quarter, but gradually level off after that.
"Summertime V-shape"—deeper contraction, bigger recovery
The “Summertime V-shape” scenario assumes that the peak of new COVID-19 cases will be higher and take more time to go down to acceptable levels than the “May reboot” scenario does. No restart of the economy would be likely before June or even July.
In this scenario, as new cases continue to escalate beyond mid-April, social distancing and other containment measures are likely to remain in place for longer. Again, this will again impact the Arts, Entertainment, Recreation, and Accommodations sector most severely, which would contract by 50 percent in March, 30 percent in April, and 20 percent in May. Transportation and Warehousing would contract by 25 percent in March and by slightly smaller percentages into April and May. The good news is that in this scenario, those sectors may come back to life by July and rebound fairly strongly during the summer.
In addition to those sectors hardest hit (listed above), the ongoing decline in consumer spending will affect other sectors such as Retail Trade, Wholesale Trade, and Manufacturing, which may see declines of between 5 and 15 percent per month from March to May, then modest recovery as of June.
Overall, the economy will contract deeply by 35.6 percent, annualized, during the second quarter, which equals a drop in GDP of more than 10 percent. The upside to the deeper contraction is that once people can resume regular activities, a sharper recovery emerges over the summer. However, by year-end, the economy will still finish below where it started, and GDP growth will show a decline of 5.5 in 2020 compared to 2019.
Unemployment will go up much faster in this scenario and could hit 15 percent by Q3, after which it may level off to 10 percent toward the end of the year.
“Fall recovery” scenario—extended contraction
The final scenario assumes a more effective and managed control of new COVID-19 cases, flattening of the curve. While this reduces the pressure on the health care system and the potential number of fatalities in the coming months, it also means that the reboot of the economy will not begin until September, especially because social distancing and other containment measures—which may eventually be relaxed somewhat—may still remain in places for several more months.
Because the period of contraction of GDP lasts longer in this scenario, more economic sectors will suffer. In addition to the sectors identified above, weakness will extend to Finance & Insurance, Professional & Business Services, and so on. We also anticipate that budget cuts and cost cutting will force more companies to reduce their workforce, raising unemployment to 15 percent—a level which might extend all the way to the end of the year.
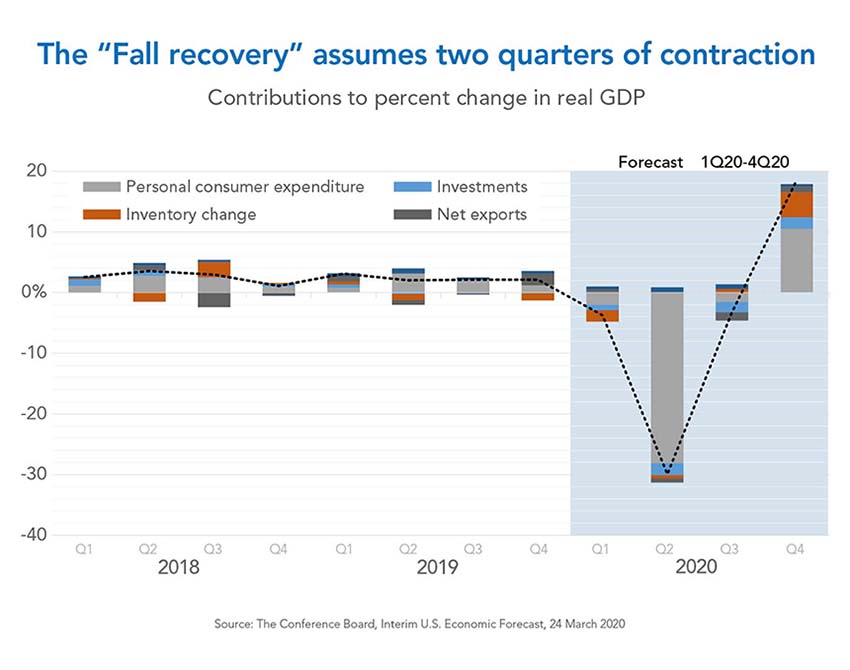
In this scenario we expect contraction in Q2 to be about 30 percent (slightly less than in the “Summertime V-shape” scenario) but continue into Q3, though at much shallower rate. While Q4 will see a rebound, the economy in all of 2020 will contract by 6 percent (over 2019). This would be the largest decline since 1946 when the economy dropped by almost 12 percent as a result of WWII demobilization and the sharp pullback in military production. (For comparison, in 2009, the economy contracted by just over 3 percent compared to 2008.)
Again, consumer spending will see the largest declines in this scenario. It will drop by 38 percent (annualized) in Q2 and only recover by 18.5 percent by Q4. Investment and exports will also suffer large contractions during Q2 and Q3. Fiscal stimuli from the government would be insufficient to offset the declines in the private sector of the economy.

One caveat of the “Fall recovery” scenario is that it assumes COVID-19 will not return in full force during the fall. To avoid a resurgence, a combination of more preventive measures, medication to treat the virus, and the emergence of immunity to it among a large part of the population will be required. We have not included a scenario that sees a large pickup in COVID-19 cases during the fall.
Economic activity will drop significantly—regardless of the scenario
Recessions are often triggered by an unexpected event, and that is certainly true for what may go down in history as the “Coronavirus Recession.” Technically, a recession occurs when an economy contracts for a period of six months or more in a row. This is not necessarily the case for all our scenarios. For example, in our “Summertime V-shape” scenario, the contraction will be deep from March to May but will be followed by a sharp rebound from June onwards. Alternatively, in the “Fall recovery” scenario, the contraction will be somewhat shallower but could last for more than six months. (For a more complete discussion of all factors that determine a recession, see the Business Cycle Dating Committee of National Bureau of Economic Research.)
Whatever the degree of economic contraction and the shape of the recovery, in all the scenarios developed for this interim forecast, the level of economic activity by the end of the 2020 will be lower than it was at the end of 2019 by between 1.6 and 6 percent. Contractions of this kind on either a quarterly or annual basis have not been seen since the aftermath of WWII.
Within various sectors, especially services, which may come to a standstill from March to possibly May, the forced contraction in consumer spending is very large. Many foregone services, such as travel and recreation, will create a permanent loss, meaning they will not be made up for through pent-up demand later in the year. This will temper the rebound. In other sectors, such as Manufacturing and Transportation & Warehousing, pent-up demand is more likely, and the gap in economic activity levels may narrow strongly by the end of the year. However, disruptions in supply chains can make a quick rebound more difficult because all links in the chain need to work smoothly again.
V, U, or L-shaped recovery: Will policy make a difference?
The nature of the growth recovery as described in the above scenarios is more or less V-shaped. The strongest V-shape would occur in the “Summertime V-shape” scenario. The “May reboot” will be less strongly V-shaped, while our “Fall recovery” scenario points more to a U-shaped growth recovery.
From the perspective of the level of economic activity, all our scenarios have a strong U-shape, as none of them include a full economic recovery to the level of late 2019 before year-end. In this interim forecast we are not providing any projection for 2021, which will be highly dependent on how the virus spreads across the United States, the economic response, and the trajectory of the economic contraction and recovery in the next three quarters, as well as the effectiveness of the policy response.
The trajectory of the pandemic and containment measures will determine whether the economy can resume growth relatively soon, or whether stringent containment measures must remain in place for longer. The latter might stretch the economic recovery out over a longer period of time. In such a case, it is critical that demand conditions be addressed. While direct income support can provide a short-term cushion, the larger risk is that massive job losses will create a drag on real income and therefore make it difficult to raise consumer spending rapidly once the economy opens up. Policy instruments ranging from subsidies for short-time working to basic income provisions to support low-income groups of the population for an extended period of time would help.
Fiscal policy tools that provide credit lines to small businesses quickly and effectively will help to stem the closure of those businesses across the country and help them reboot quickly once the recovery begins. Larger businesses benefit primarily from clear guidance on the timing of the reboot of the economy. Coordination across states is of critical importance. If kinks in supply chains are not unlocked in a coordinated way, disruption is likely to continue for much longer.

