

Loading...
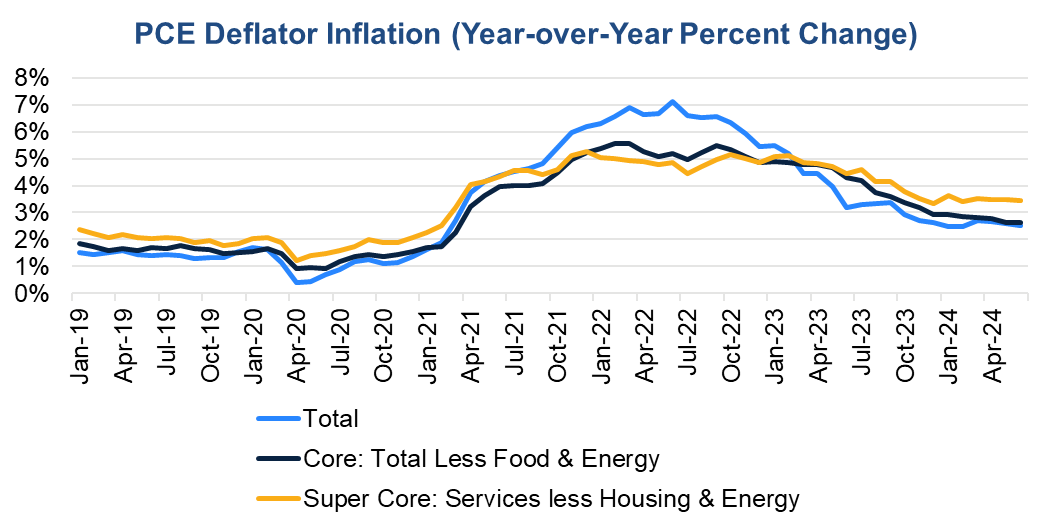
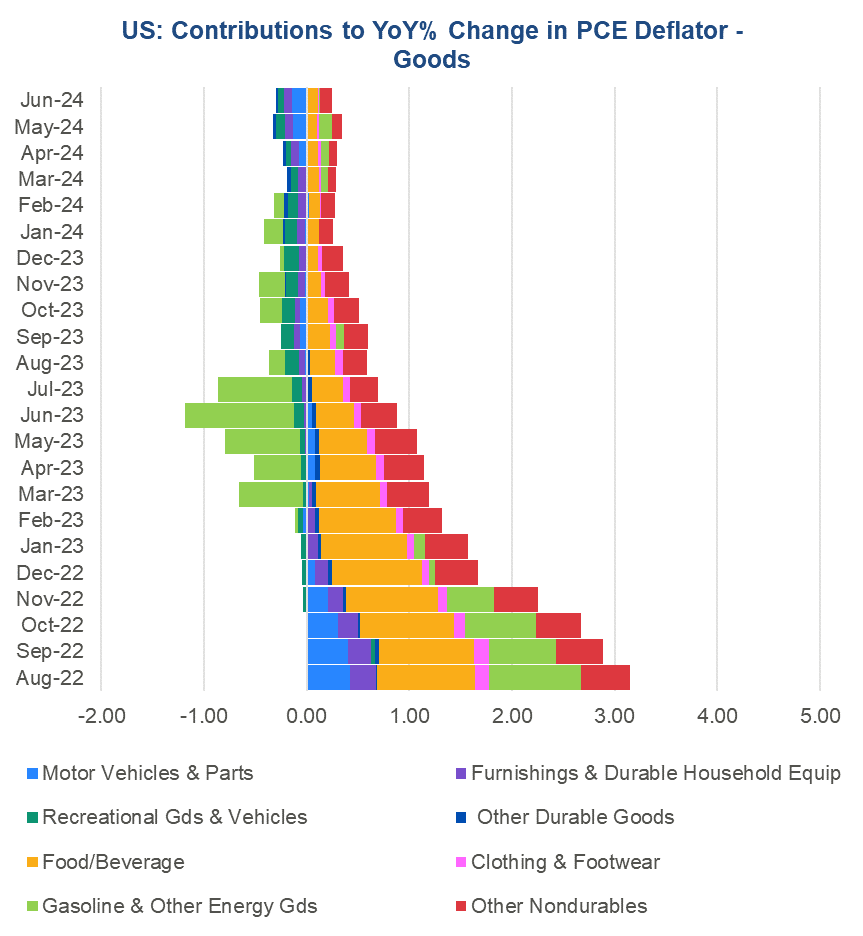
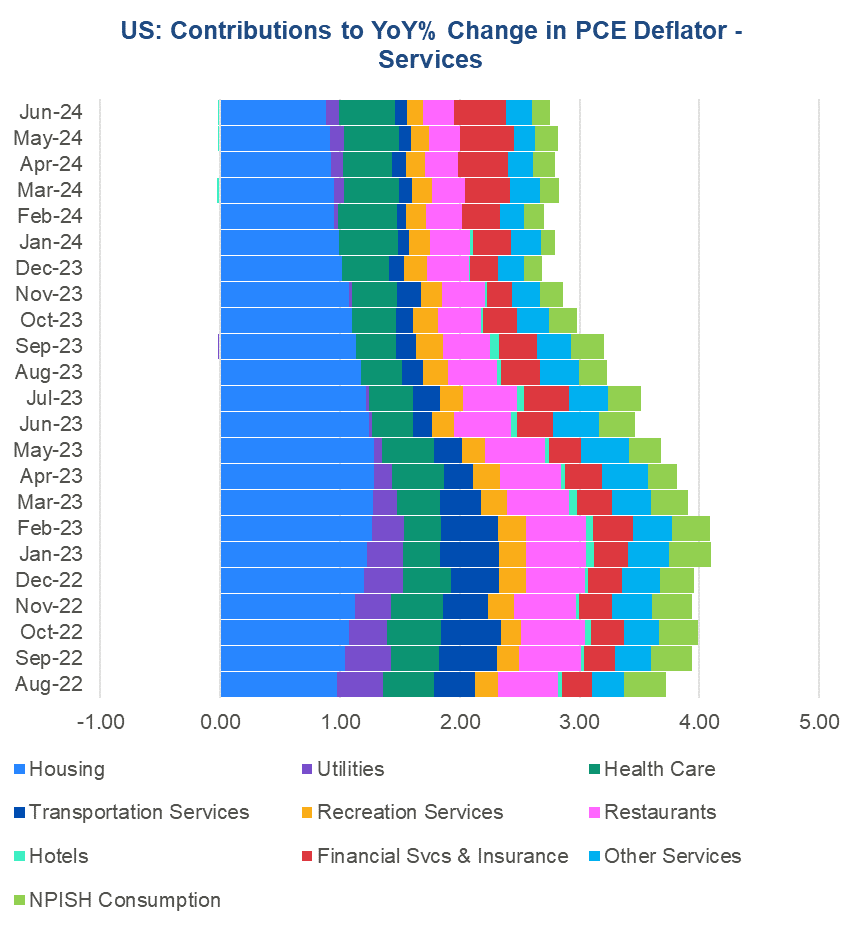
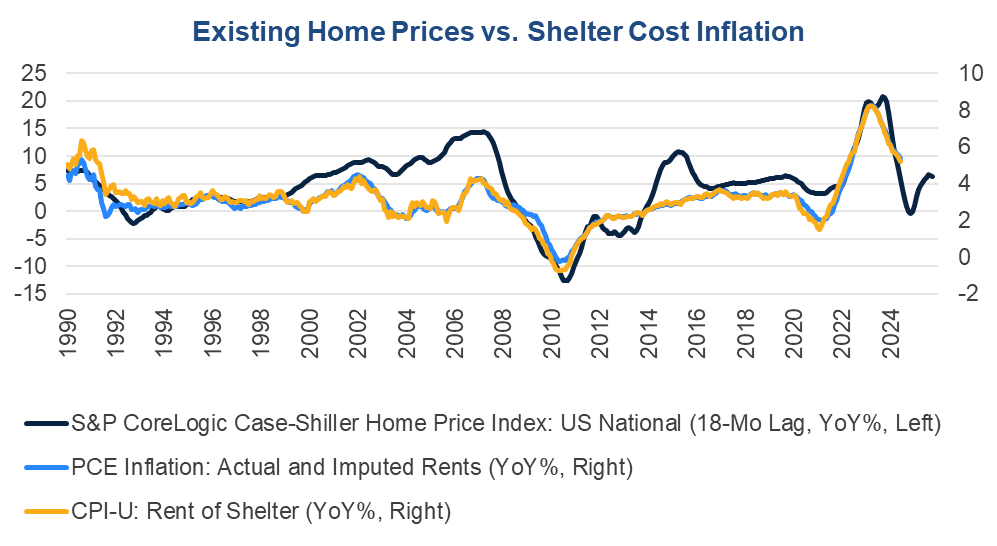
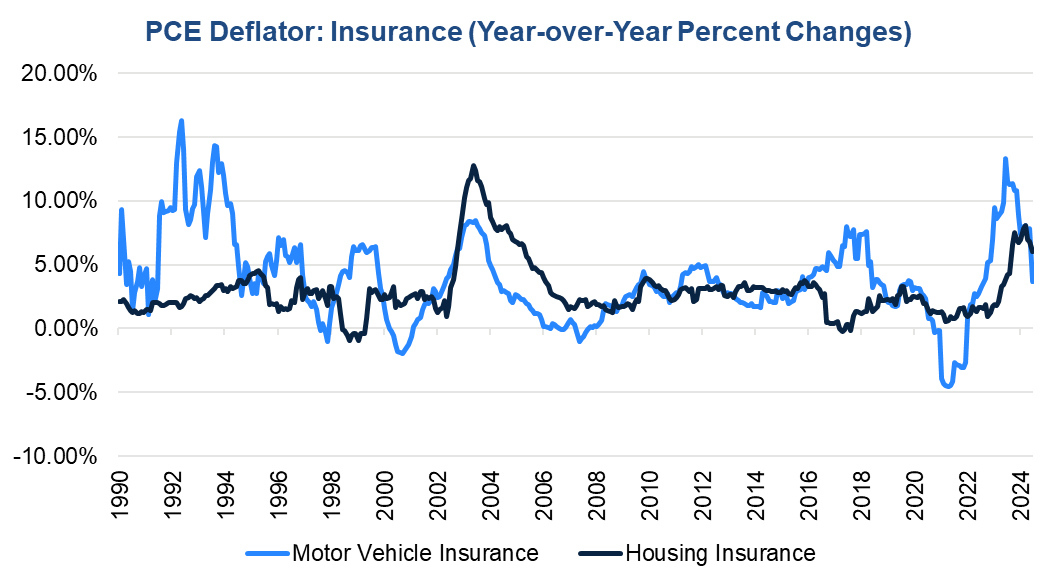
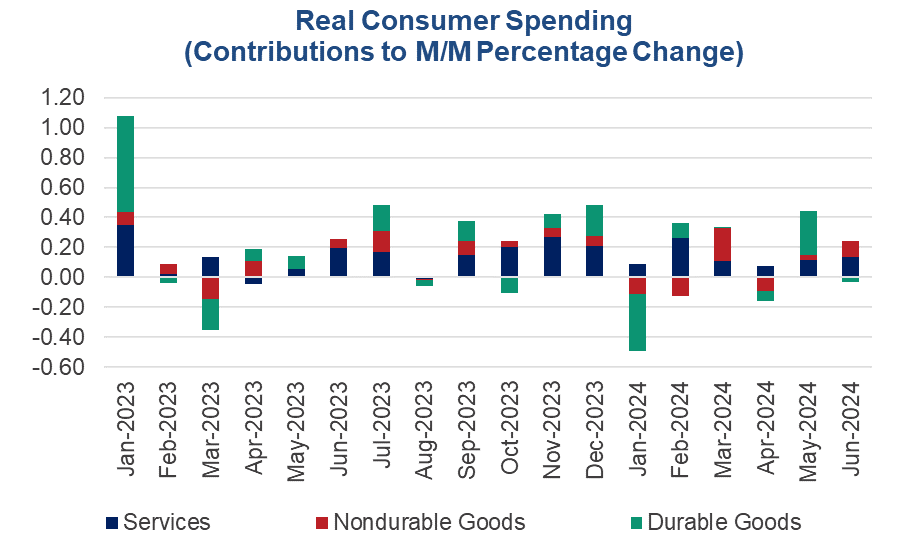
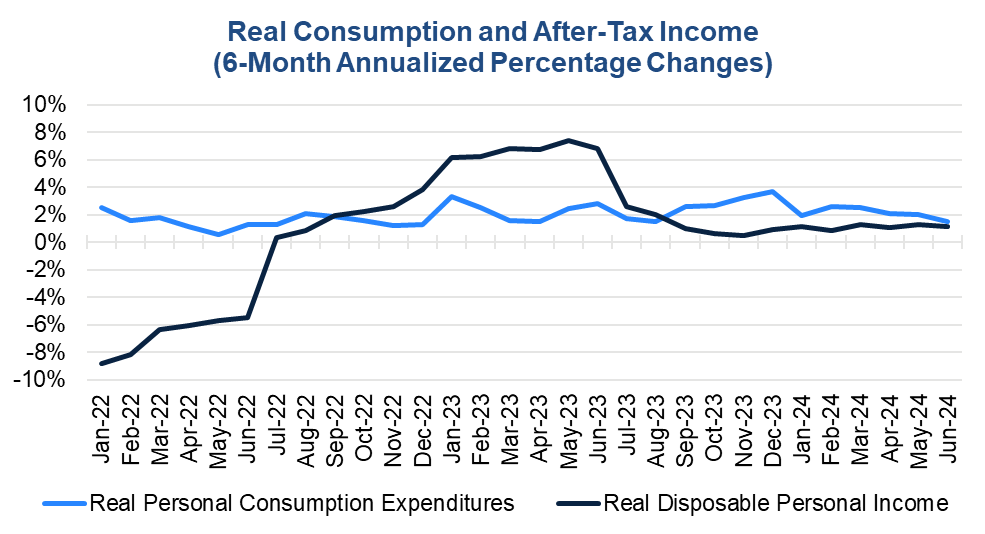
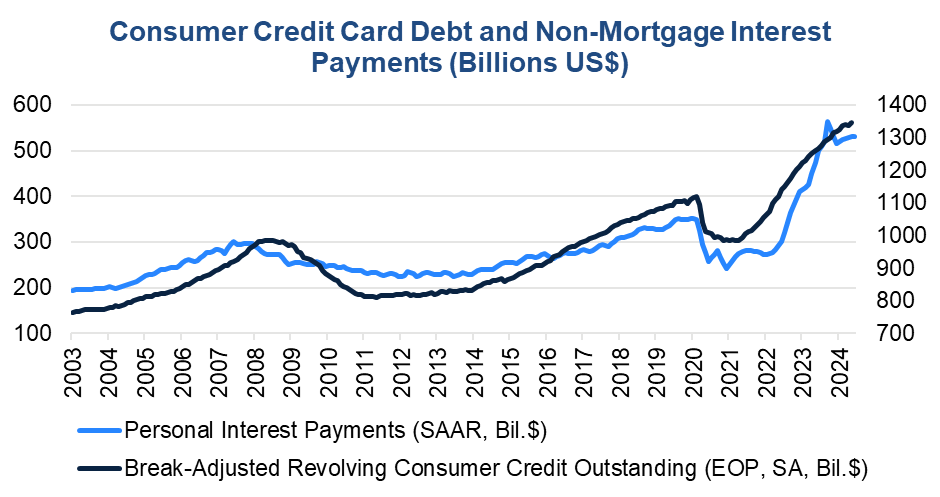
The Personal Consumption Expenditure (PCE) price index continued to slow in June 2024, drawing the Fed closer to confidence that inflation is on track towards the 2-percent target. Importantly, shelter costs, a major contributor to year-over-year inflation continue to slow. However, core services prices remain sticky and are slowing progress. Real consumer spending weakened in the month providing slower momentum heading into the third quarter. Additionally, consumers are focusing services spending more on necessities than desires. Still, real spending tracked slightly above real after-tax income growth in June, and consumers continued to pile on debt to supplement incomes. The savings rate continued to fall as a result. These factors, coupled with rising debt service, are stoking consumer credit delinquencies that may prove troublesome for the banking sector. Trusted Insights for What’s Ahead® Report Highlights PCE inflation continued to slow on a year-over-year basis. Total PCE inflation increased by 2.5 percent year-over year in June compared to 2.6 percent in May. Core inflation (i.e., total less food and energy) was unchanged at 2.6 percent year-over-year. Total inflation was up 0.1 percent month-over-month in June, and the core rose by 0.2 percent month-over-month. Figure 1: Inflation heading in right direction, but core services slow progress to 2-percent target Sources: Bureau of Economic Analysis and The Conference Board. Goods prices are falling. Goods inflation was negative year-over-year for a second month as rising costs for nondurable goods like food and energy are more than being offset by falling prices for many durable goods. Motor vehicle and furniture prices were down month-over-month and year-over-year. Indeed, lower prices for autos and furniture might have boosted real goods spending in Q2, despite still elevated financing costs for big ticket items. Figure 2. Rising nondurable goods prices being more than offset by falling durable goods prices Sources: Bureau of Economic Analysis and The Conference Board. Services still driving most inflation. Rising services costs continued to be the primary drivers of year-over-year inflation. The good news is that shelter, which comprises a large share of households’ consumption basket, is experiencing less aggressive increases in costs. Indeed, shelter cost inflation gauges, which include rents and imputed rents (i.e., what a homeowner would receive if she rented her house), are cooling consistent with past slowing in home prices and market rents. Additionally, insurance costs for motor vehicles and homes are not rising as aggressively, helping to offset still rapidly rising costs for health insurance and other types of financial services products. The bad news is that labor shortages, especially in front-line worker sectors, are keeping wages elevated, and thereby placing upward pressure on prices for other types of services. Figure 3. Services largely fueling PCE inflation Sources: Bureau of Economic Analysis and The Conference Board. Figure 4. Past home price easing suggests further cooling in shelter costs Sources: S&P, Bureau of Economic Analysis, Bureau of Labor Statistics, and The Conference Board. Figure 5. Insurance cost inflation starting to cool Sources: Sources: Bureau of Economic Analysis and The Conference Board. Real spending cools and rotates. Nominal consumer spending rose by 0.3 percent month-over-month in June after increasing by 0.4 percent in May. Real spending, which accounts for inflation, increased by 0.2 percent month-over-month in June compared to 0.4 percent in May. The slower pace of consumption reflected a slight decline in durable goods purchases after a surge in May. Still, looking at spending in recent months, consumers have dialed back their spending on services, and are spending more on services they need like housing and healthcare instead of wants. Figure 6. Consumer spending slowed at the end of Q2 2024 Sources: Sources: Bureau of Economic Analysis and The Conference Board. Incomes rising year-over-year. Personal income, in both real and nominal terms increased at a slower clip in June compared to May. Overall income rose by 0.2 percent in June versus 0.4 percent in May. Real income increased by just 0.1 percent in June after a 0.4 percent pop in May. Despite the slower month-on-month increases, personal income rose slightly faster year-over-year in June than in May. Real disposable personal income (i.e., personal income after paying taxes) also increased more slowly month-over-month, but faster year-over-year. Debt is up and savings is down. Nonetheless, real spending growth is still tracking slightly above real after-tax income growth. As a result, the personal savings rate edged down to 3.4 percent in June from 3.5 percent in May. Consumers are still leveraging up to supplement incomes and paying higher interest costs as a consequence. Moreover, more consumers are falling behind on their consumer credit debt – raising costs for the financial institutions that issued the debt to them. Figure 7. Consumption still tracking slightly above after-tax income Sources: Sources: Bureau of Economic Analysis and The Conference Board. Figure 8. Consumers are still piling on debt and accruing more interest on the debt Sources: Sources: Bureau of Economic Analysis, Federal Reserve Board, and The Conference Board. Figure 9: Consumer credit delinquencies on the rise Source: FRBNY Consumer Credit Panel/Equifax and The Conference Board.

Retail Sales Show Consumers Stock Up ahead of Tariffs
April 16, 2025
US Seeks Shipbuilding Revival, Muting of China Dominance
April 14, 2025
March CPI May Hint at Consumer Pullback as Tariffs Rise
April 10, 2025
The US-China Trade War Escalates
April 09, 2025
