
May PCE Reaction: Spending Patterns Shift, but Inflation Remains
25 Jun. 2021 | Comments (0)
May income, spending and inflation data reveal an economy that is shifting back to pre-pandemic patterns as the threat of COVID-19 abates. Following the distribution of government stimulus checks in March US personal income dipped for a second month in May. However, income derived from wages continued to rise as the US labor market gradually heals. May consumer spending was roughly flat from April, but the amount spent on services continued to rise as the economy reopens. Finally, PCE price inflation (headline and core) continued to rise in year-over-year terms, but price increases slowed in month-over-month terms. This may suggest that the worst price increases are behind the US economy. Looking forward, we continue to expect a strong economic recovery over the coming quarters.
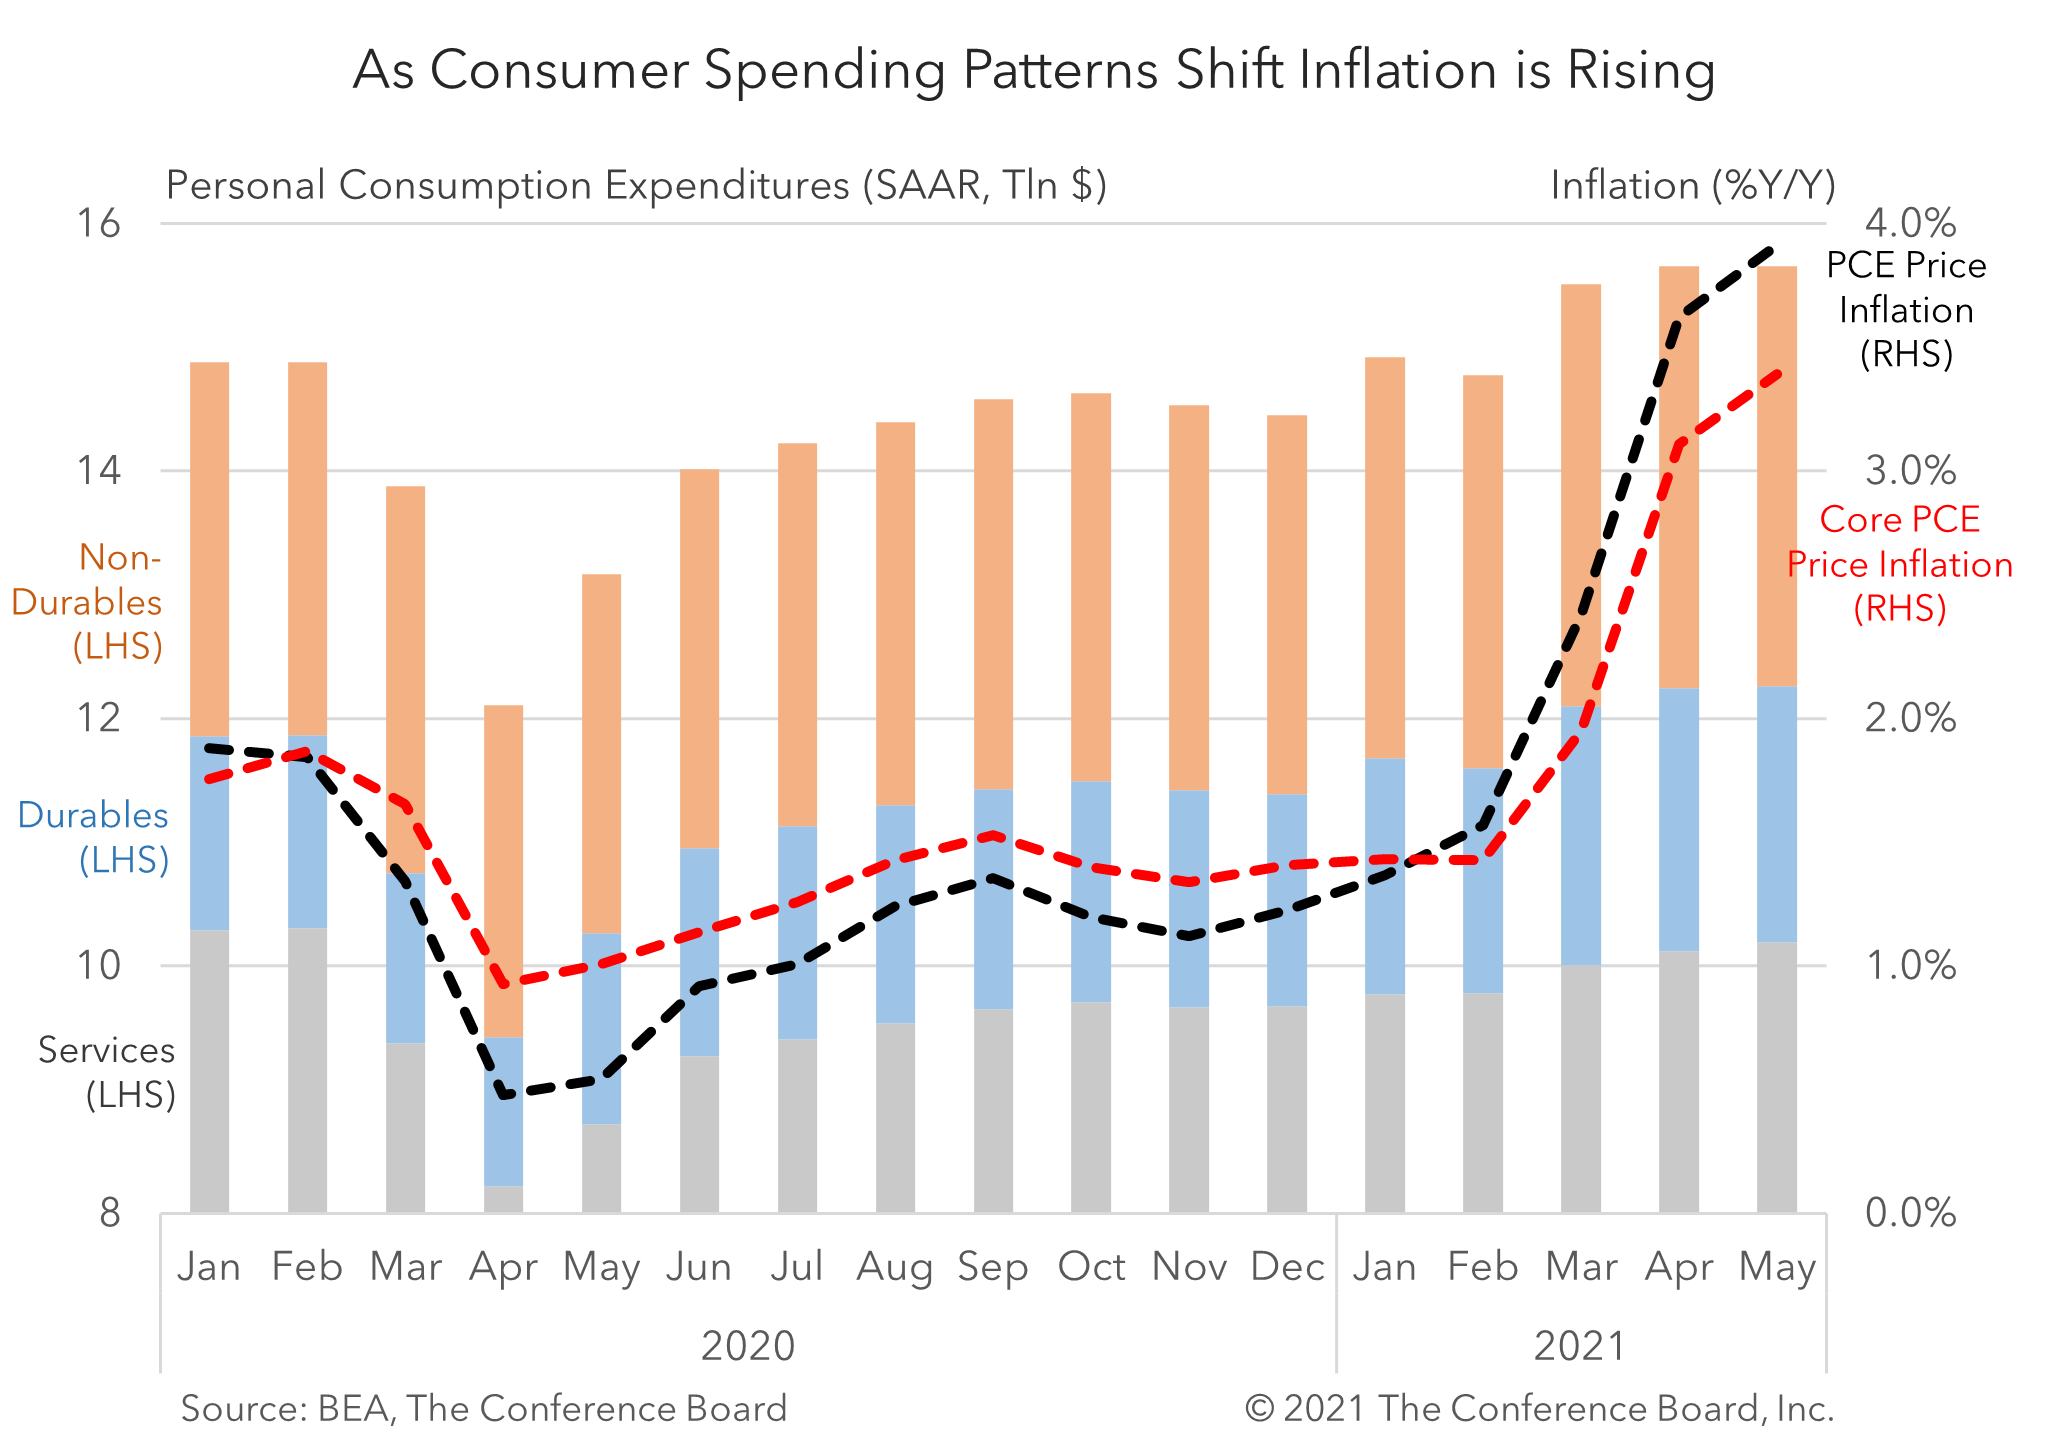
PCE inflation continued to rise in May. Headline PCE inflation rose to 3.9% y/y, vs. 3.6% y/y in April. The primary driver of this month’s uptick in prices was associated with durable goods, which rose 1.6% m/m, vs. 0.1% m/m for non-durable goods, and 0.3% m/m for services. Critically, the BEA also reported that Core PCE Inflation rose to 3.4% y/y in May from 3.1% y/y in April and 1.9% y/y in March. While these key inflation metrics all rose in year-over-year terms, which are subject to base effects, they all dropped in month-over-month terms (May PCE Inflation fell to 0.4% m/m from 0.6% m/m in April; and May Core PCE Inflation fell to 0.5% m/m from 0.7% m/m in April). While elevated inflation rates are unlikely to return to historical averages in the immediate future these most recent data suggest that the strongest inflationary period may have passed.
Personal Consumption Expenditures (annualized) rose by $2.9 billion to $15.7 trillion in May about flat from the all-time high of $15.7 trillion in April. Total US consumer spending is now 5.3% higher than it was in February 2020, just before the COVID-19 pandemic took root in the US. However, the composition of this spending continues to be lopsided. Consumer spending on goods is up 19.7% from February 2020 while spending on services, which accounted for over two-thirds of consumer spending in 2019, is down 1.2% from its pre-pandemic level. In May, US consumer spending on goods fell by $71.4 billion while spending on services rose $74.3 billion. Looking forward, consumer spending patterns are likely to continue to pivot back towards services as the economy fully reopens.
Personal Income (annualized) fell to $20.8 trillion in May, vs. $21.2 trillion in April and a record setting $24.4 trillion in March. The distribution of the bulk of a new round of government stimulus checks in March exaggerated these data that month and is resulting in these recent declines in these headline income data. However, income attributed to Employee Compensation rose to $12.4 trillion from $12.3 trillion in April and $12.2 trillion in March. This trend is encouraging, as it underlines the ongoing momentum in the labor force recovery that we expect to continue over the coming quarters.
The personal savings rate fell to 12.4% in May from 14.5% in April and 27.6% in March. This decline was anticipated and is associated with the timing of government stimulus check distributions. We expect savings to continue to decline as many COVID-19-era government benefits ebb and households dip into these funds to spend more lavishly over the coming months - especially on services.
-
About the Author:Erik Lundh
Erik Lundh is Senior Global Economist for The Conference Board Economy, Strategy & Finance Center, where he focuses on monitoring global economic developments and overseeing the organization&rsquo…


0 Comment Comment Policy