Blue Collar Workers are no Longer Singing the Blues
The Conference Board uses cookies to improve our website, enhance your experience, and deliver relevant messages and offers about our products. Detailed information on the use of cookies on this site is provided in our cookie policy. For more information on how The Conference Board collects and uses personal data, please visit our privacy policy. By continuing to use this Site or by clicking "OK", you consent to the use of cookies. 

The Employment Cost Index (ECI) is considered an especially accurate measure of wage growth over time and is highly correlated with labor market conditions. It accounts for changes in the occupation and industry distribution of the workforce, and therefore is not subject to the impact of compositional changes on wage growth[1]. Another important feature of the ECI is that it provides measures of wage growth by groups of occupations, which allows us to understand which occupations are responsible for trends in the overall wage growth. Critically, this allows for a comparison of wage growth for blue and white-collar workers, which shows surprisingly that earning for the former are growing faster.

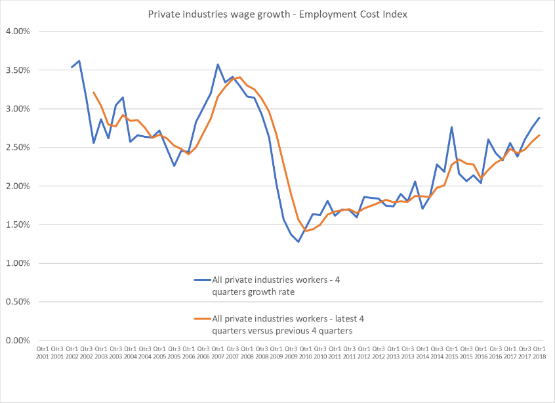
At the end of April, the Employment Cost Index for the first quarter was released. In chart one, we show two measures of the Employment Cost Index. The blue line is the four-quarter growth rate of the wage and salary measure for private industry workers. The orange line shows a smoother version of the first line - the percent change between the average wage of the four most recent quarters and the average of the previous four quarters. Both measures show that there has been continuous acceleration since 2009. The current growth rate is about double the rate prevailing in 2009.  The growth rate of this measure of the employment cost index is in line with the growth rate during the 2002-2006 period but is still more than half a percentage point lower than in 2007.


Chart 1
ECI chart 1

Source: Bureau of Labor Statistics


Perhaps surprisingly, the acceleration in recent years is not coming from highly educated occupations, but rather from blue-collar occupations. Using ECI data by occupation, we have constructed wage growth measures for blue-collar and white-collar occupations. The two measures are shown in chart two.

Blue collar occupations include:  construction, extraction, farming, fishing, forestry, installation, maintenance, repair, production, transportation, material moving, healthcare support, protective service, food preparation and serving, building and grounds cleaning, and personal care and service occupations. White-collar occupations include management, business, financial, professional, sales, office and administrative support occupations.

The chart shows a significant acceleration in recent years in blue collar occupations. Their wage growth rate is almost back to the 2007 level.  However, the acceleration in the wage growth of white-collar occupations was much milder and is still almost one percentage point lower than in 2007.


Chart 2

Chart2_eci

Source: Bureau of Labor Statistics


Chart Three shows the annual growth rate of the last four quarters compared to the previous four quarters for the nine main groups of occupations. It shows that the five groups in the blue-collar occupations are all growing faster than any of the four groups in the white-collar occupations. The group with the fastest wage growth is transportation and material moving.


Chart 3
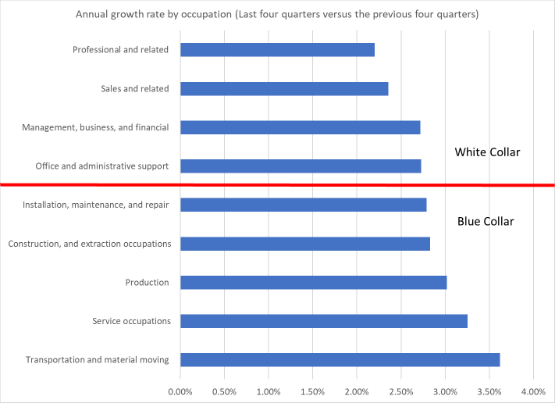
Chart3_eci

Source: Bureau of Labor Statistics


Chart Four shows the gap in the wage growth between the latest numbers and the last four quarters and 2007, which was the period with the fastest growth rate before the financial crisis. Most groups of occupations are still experiencing wage growth that is slower than in 2007, but production workers and workers in transportation and material moving are experiencing faster wage growth than in 2007.


Chart 4
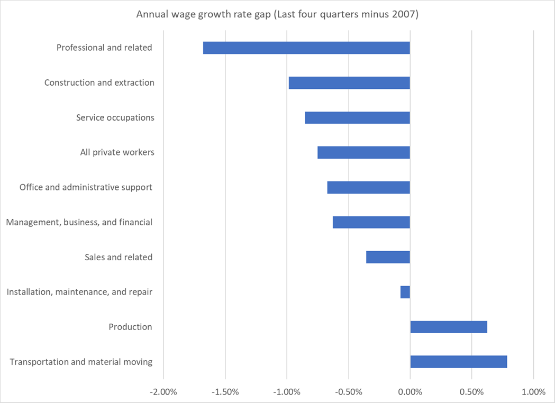
Chart4_eci

Source: Bureau of Labor Statistics


The faster growth in wages for blue-collar workers is somewhat surprising, especially since throughout most recent history, white-collar wage growth was higher. In a future blog, we will discuss some of the potential reasons for the faster acceleration in wage growth of blue-collar occupations versus white-collar, and the reasons for the very fast growth in the wages of transportation workers.

We expect labor markets to continue to tighten in the coming years, which will only apply more wage and price pressures across the economy. There are already signs that faster wage growth is already spilling over to producer prices. Producer price index for transportation and warehousing of goods, reached almost 5% in the past 4 quarters. As higher labor costs continue to chip away at corporate profits, companies across many industries will be forced to raise prices, which is one of the reasons why a growing number of economists and the Federal Reserve are becoming more worried about inflation.


[1] Whereas the commonly cited BLS payroll survey’s average hourly earnings measure may be influenced by a fall in the share of retail workers in total employment for example, the ECI measures holds the occupation and industry composition of the workforce constant allowing the measure to focus on how quickly earnings for workers remaining in a given industry and occupation are growing.

Blue Collar Workers are no Longer Singing the Blues

Blue Collar Workers are no Longer Singing the Blues

04 Jun. 2018 | Comments (1)

The Employment Cost Index (ECI) is considered an especially accurate measure of wage growth over time and is highly correlated with labor market conditions. It accounts for changes in the occupation and industry distribution of the workforce, and therefore is not subject to the impact of compositional changes on wage growth[1]. Another important feature of the ECI is that it provides measures of wage growth by groups of occupations, which allows us to understand which occupations are responsible for trends in the overall wage growth. Critically, this allows for a comparison of wage growth for blue and white-collar workers, which shows surprisingly that earning for the former are growing faster.

At the end of April, the Employment Cost Index for the first quarter was released. In chart one, we show two measures of the Employment Cost Index. The blue line is the four-quarter growth rate of the wage and salary measure for private industry workers. The orange line shows a smoother version of the first line - the percent change between the average wage of the four most recent quarters and the average of the previous four quarters. Both measures show that there has been continuous acceleration since 2009. The current growth rate is about double the rate prevailing in 2009.  The growth rate of this measure of the employment cost index is in line with the growth rate during the 2002-2006 period but is still more than half a percentage point lower than in 2007.


Chart 1

ECI chart 1

Source: Bureau of Labor Statistics


Perhaps surprisingly, the acceleration in recent years is not coming from highly educated occupations, but rather from blue-collar occupations. Using ECI data by occupation, we have constructed wage growth measures for blue-collar and white-collar occupations. The two measures are shown in chart two.

Blue collar occupations include:  construction, extraction, farming, fishing, forestry, installation, maintenance, repair, production, transportation, material moving, healthcare support, protective service, food preparation and serving, building and grounds cleaning, and personal care and service occupations. White-collar occupations include management, business, financial, professional, sales, office and administrative support occupations.

The chart shows a significant acceleration in recent years in blue collar occupations. Their wage growth rate is almost back to the 2007 level.  However, the acceleration in the wage growth of white-collar occupations was much milder and is still almost one percentage point lower than in 2007.


Chart 2

Chart2_eci

Source: Bureau of Labor Statistics


Chart Three shows the annual growth rate of the last four quarters compared to the previous four quarters for the nine main groups of occupations. It shows that the five groups in the blue-collar occupations are all growing faster than any of the four groups in the white-collar occupations. The group with the fastest wage growth is transportation and material moving.


Chart 3

Chart3_eci

Source: Bureau of Labor Statistics


Chart Four shows the gap in the wage growth between the latest numbers and the last four quarters and 2007, which was the period with the fastest growth rate before the financial crisis. Most groups of occupations are still experiencing wage growth that is slower than in 2007, but production workers and workers in transportation and material moving are experiencing faster wage growth than in 2007.


Chart 4

Chart4_eci

Source: Bureau of Labor Statistics


The faster growth in wages for blue-collar workers is somewhat surprising, especially since throughout most recent history, white-collar wage growth was higher. In a future blog, we will discuss some of the potential reasons for the faster acceleration in wage growth of blue-collar occupations versus white-collar, and the reasons for the very fast growth in the wages of transportation workers.

We expect labor markets to continue to tighten in the coming years, which will only apply more wage and price pressures across the economy. There are already signs that faster wage growth is already spilling over to producer prices. Producer price index for transportation and warehousing of goods, reached almost 5% in the past 4 quarters. As higher labor costs continue to chip away at corporate profits, companies across many industries will be forced to raise prices, which is one of the reasons why a growing number of economists and the Federal Reserve are becoming more worried about inflation.


[1] Whereas the commonly cited BLS payroll survey’s average hourly earnings measure may be influenced by a fall in the share of retail workers in total employment for example, the ECI measures holds the occupation and industry composition of the workforce constant allowing the measure to focus on how quickly earnings for workers remaining in a given industry and occupation are growing.

  • About the Author:Gad Levanon, PhD

    Gad Levanon, PhD

    The following is a biography of former employee/consultant Gad Levanon is the former Vice President, Labor Markets, and founder of the Labor Market Institute. He led the Help Wanted OnLine©…

    Full Bio | More from Gad Levanon, PhD


1 Comment Comment Policy

Please Sign In to post a comment.
  1. Trey Jackson 0 people like this 11 Jul. 2018 09:46 AM

    Gad - I look forward to the future blog you mention, as I'm interested in determining if the blue collar wage growth is driven by additional overtime demands of that sector of the workforce increasing. If I understand the ECI correctly, that is a component within the overall calculation, and it would be helpful to understand which components within the ECI are making the change most dramatic.


hubCircleImage