The Rising Role of Older Women in the Labor Force and Why “Full Employment” May Get Still Fuller
The Conference Board uses cookies to improve our website, enhance your experience, and deliver relevant messages and offers about our products. Detailed information on the use of cookies on this site is provided in our cookie policy. For more information on how The Conference Board collects and uses personal data, please visit our privacy policy. By continuing to use this Site or by clicking "OK", you consent to the use of cookies. 

According to The Conference Board’s Global Labor Market Outlook, labor markets continue to tighten with the economy at or near “full employment,” leaving employers having a more difficult time filling positions and retaining workers in certain occupations and industries. At the same time, the long-term demographic trend of an aging population continues, causing both greater demand for certain types of workers (especially in healthcare services), and lower supply of skilled and experienced workers as the baby boomer generation retires.

Without much progress on the immigration policy front, the best hope to increase available labor supply is to keep the current workforce engaged in work, particularly the segments of the workforce that are largest and growing: middle-aged, near-retirement, older-than-prime age workers in the 55+ categories:
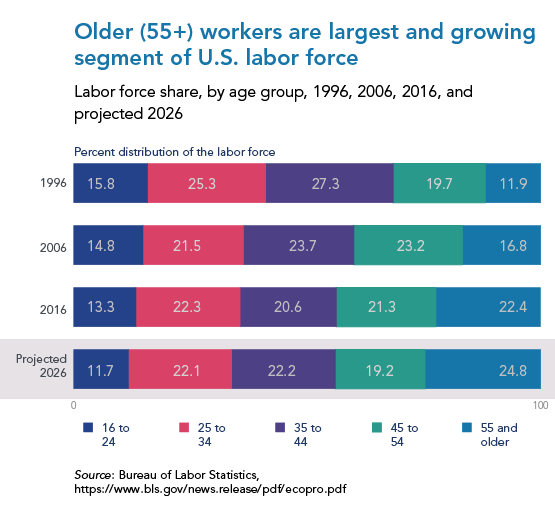

55+ women


Yet a closer look at labor force trends and projections shows important distinctions between the men vs. the women and lots of reasons why the future of the labor market is (disproportionately) female:
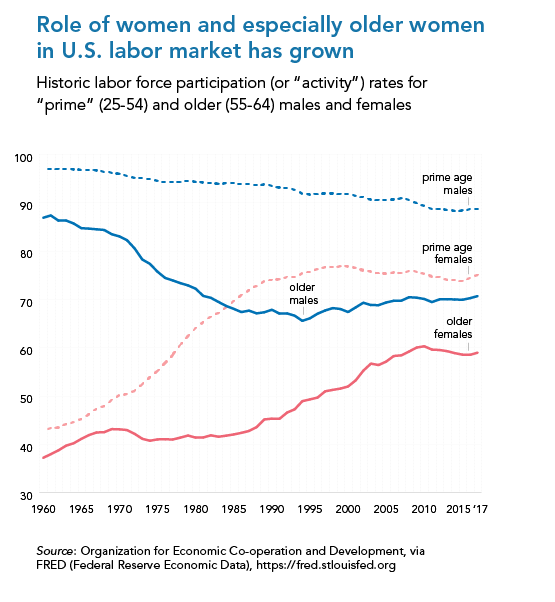

55+ women participation


55-64 year old women are a particularly fast growing segment of the workforce and arguably not “past their prime” regarding work. (Full disclosure: I am one of them!) Note that 55-64 female labor force participation rate is now around 60%--as high as “prime age” (25-54) female participation rate was in the late 1970s (when I was in high school). In fact, many of these older women have more time to participate in the labor force now than when they were in their “prime” years and had kids at home (and likely more childcare responsibilities than their spouses did). At the same time, older women are typically more secure financially than when they were younger, so they often have more discretion about how to spend their time. “Work” is not just a job and not just for the money, but something they enjoy for the sense of purpose, social interactions, and continued intellectual growth it provides. For “work” to be more appealing than not working, for the labor market to hold onto these highly-skilled and experienced women, employers will have to let go of the old, cookie-cutter 9-to-5 type of job. 

In contrast, male labor force participation has been on an overall decline over the decades, and 55+ men still participate at much lower rate than 25-54 men (although the 55+ rate bottomed out in mid 1990s and is now around 70%, still higher than female 55+ participation).

According to the Bureau of Labor Statistics (BLS), labor force participation rates over the past decade (2006-16) have also risen faster for 55-64 yr. old women than for 55-64 yr. old men—in absolute (% point gains) and not just relative (% increase) terms.

And looking ahead, BLS’s labor force projections show women contributing an outsized role:

  • Women overall will add 5.9 million of the 10.5 million new workers (56.8%) from 2016-26.
  • Older women (55+) are 3.6 million of these new women in the workforce (60.5% of the women).
  • With 21.6% growth, women age 55 and over are the single fastest growing age-gender category over next decade.
  • The gender-age category with the biggest percentage point increase in labor force participation rate: women ages 60-64!  (+5.9% points, 50.1 to 56.0%--driven by +6.9% points (57.0 to 63.9%) for ages 60-61).
  • Age-gender subcategory with the biggest annual growth rate: women age 75 and over! (8.8%, or +4.9% points from 9.5% to 12.7%)

BLS projects the recent contrast in participation trends between older (55+) women compared with men to extend over the next decade:

  • Women: participation rises overall, from 34.7% to 34.9%--especially strong in the 55-64 age category (58.4 to 63.4%)
  • Men: declining participation for ages 55+ overall (46.2% to 43.4%) and for ages 55-64 (70.2 to 70.1%).

There is a good confluence of demographic and economic reasons why these projections make sense—why when it comes to the labor market, “the future is female”:

  • Demographically, the age 55-64 female share of the overall population is rising (these are baby boomer women, after all);
  • Women work disproportionately in the service-sector jobs, and service-sector employment as share of overall employment is still steadily rising (especially in highest-demand, health and human service occupations).  From BLS/Current Population Survey data, in 2017 women made up:
    • 56.6% of all service occupations (15.1 million/26.8 million jobs)
    • 87.1% of healthcare support occupations (3.06 million/3.51 million jobs)
    • 76.1% of personal care and services occupations (4.52 million/5.94 million jobs, 93.7% of childcare jobs and 83.7% of personal care aides)
    • 66.1% of community and social services occupations, especially social workers (82.5%)
    • Highest-shortage health occupations: 89.9% of registered nurses, 92.2% of nurse practitioners, 70.9% of physician assistants, 87.6% of occupational therapists;
    • Meanwhile, men still make up the majorities of goods-producing, “production” occupations (which are only 28.9% female), and these are jobs have been declining for decades as they’re more likely to be offshored or automated;
    • The jobs left to humans to deliver in-person services require more “soft skills” that women tend to be better at (and get better at with age).

In addition, life-cycle factors explain the rise of older women, in particular:

  • Women are relatively healthier (physically and cognitively/emotionally) at older ages;
  • Women are more “free” to participate in labor market after kids are grown (even if they have parental/elder care responsibilities);
  • Female educational attainment has been rising faster than for men, leading to career paths that have greater longevity (more cerebral, less physical). Women are thus becoming an increasing share of higher-skilled human capital.
  • These life-cycle factors imply that in contrast to men, market-based labor productivity for women tends to rise from their 30s and 40s to their 50s and 60s.

Finally, the increase in “flexible” and independent/contract work arrangements make it easier for these older women (and older men as well) to combine work with the rest of what they choose to do with their lives, thus making it more likely that age 55+ women will choose to stay in the workforce when in the past they might have more likely turned down the opportunity to work, if a standard 40-hours/week 9-to-5 job was their only work option. 

The rise of older women in the labor force is likely already affecting what the “new normal” of “full employment” looks like, and how well (or not so well) we are measuring it. Because older workers often consider themselves as on the cusp of retirement, it is common for them to move in and out of the definition of “labor force participation” depending on how actively they consider themselves as looking for work. Our economy’s true, potential labor force capacity is likely undercounted at any point in time as older workers may periodically yet not permanently self-identify themselves as out of the labor market (not working and not looking for work) and into retirement.  As Joseph Coughlin, Director of MIT’s AgeLab, argues in his 2017 book The Longevity Economy:

“Often, especially in the 60-plus set, older people who want to work but can’t find any simply say they’re retired. Traditional employment metrics fail to account for this population of would-be workers, which should technically be categorized as unemployed, not retired. And that population is sizable: In one major survey, 40 percent of people who described themselves as retired said they would have preferred to keep on working, and 30 percent said they would jump back into the workforce if the right job opened up.” (pg. 252)

So, there are more potential workers out there among the older population and so we might not yet be truly fully at our “full employment” capacity, but competition for these potential workers is still fierce. Given the rising role of older women in the workforce, employers would benefit from a shift in their mindsets and strategies to compete more effectively for them. They must stop thinking that all it takes is more money to attract and keep workers. The plus side from the employer’s perspective is that working women are more willing to trade off flexibility and other non-monetary perks against higher wages (which is one explanation for the gender pay gap), which has kept labor costs relatively low in this latest installment of “full employment” (which has relatively more older women in it than previous versions). In other words, the rise of women relative to men in the labor force—along with the relative increase in female-dominated and generally lower-paying service sector employment—may be one significant reason why wage growth in this economic recovery has not been as fast as expected or what we are used to experiencing. But it’s also a reason why we can think optimistically that the labor market (and our economy’s true capacity) still hasn’t maxed out.

The Rising Role of Older Women in the Labor Force and Why “Full Employment” May Get Still Fuller

The Rising Role of Older Women in the Labor Force and Why “Full Employment” May Get Still Fuller

04 Jun. 2018 | Comments (0)

According to The Conference Board’s Global Labor Market Outlook, labor markets continue to tighten with the economy at or near “full employment,” leaving employers having a more difficult time filling positions and retaining workers in certain occupations and industries. At the same time, the long-term demographic trend of an aging population continues, causing both greater demand for certain types of workers (especially in healthcare services), and lower supply of skilled and experienced workers as the baby boomer generation retires.

Without much progress on the immigration policy front, the best hope to increase available labor supply is to keep the current workforce engaged in work, particularly the segments of the workforce that are largest and growing: middle-aged, near-retirement, older-than-prime age workers in the 55+ categories:


55+ women


Yet a closer look at labor force trends and projections shows important distinctions between the men vs. the women and lots of reasons why the future of the labor market is (disproportionately) female:


55+ women participation


55-64 year old women are a particularly fast growing segment of the workforce and arguably not “past their prime” regarding work. (Full disclosure: I am one of them!) Note that 55-64 female labor force participation rate is now around 60%--as high as “prime age” (25-54) female participation rate was in the late 1970s (when I was in high school). In fact, many of these older women have more time to participate in the labor force now than when they were in their “prime” years and had kids at home (and likely more childcare responsibilities than their spouses did). At the same time, older women are typically more secure financially than when they were younger, so they often have more discretion about how to spend their time. “Work” is not just a job and not just for the money, but something they enjoy for the sense of purpose, social interactions, and continued intellectual growth it provides. For “work” to be more appealing than not working, for the labor market to hold onto these highly-skilled and experienced women, employers will have to let go of the old, cookie-cutter 9-to-5 type of job. 

In contrast, male labor force participation has been on an overall decline over the decades, and 55+ men still participate at much lower rate than 25-54 men (although the 55+ rate bottomed out in mid 1990s and is now around 70%, still higher than female 55+ participation).

According to the Bureau of Labor Statistics (BLS), labor force participation rates over the past decade (2006-16) have also risen faster for 55-64 yr. old women than for 55-64 yr. old men—in absolute (% point gains) and not just relative (% increase) terms.

And looking ahead, BLS’s labor force projections show women contributing an outsized role:

  • Women overall will add 5.9 million of the 10.5 million new workers (56.8%) from 2016-26.
  • Older women (55+) are 3.6 million of these new women in the workforce (60.5% of the women).
  • With 21.6% growth, women age 55 and over are the single fastest growing age-gender category over next decade.
  • The gender-age category with the biggest percentage point increase in labor force participation rate: women ages 60-64!  (+5.9% points, 50.1 to 56.0%--driven by +6.9% points (57.0 to 63.9%) for ages 60-61).
  • Age-gender subcategory with the biggest annual growth rate: women age 75 and over! (8.8%, or +4.9% points from 9.5% to 12.7%)

BLS projects the recent contrast in participation trends between older (55+) women compared with men to extend over the next decade:

  • Women: participation rises overall, from 34.7% to 34.9%--especially strong in the 55-64 age category (58.4 to 63.4%)
  • Men: declining participation for ages 55+ overall (46.2% to 43.4%) and for ages 55-64 (70.2 to 70.1%).

There is a good confluence of demographic and economic reasons why these projections make sense—why when it comes to the labor market, “the future is female”:

  • Demographically, the age 55-64 female share of the overall population is rising (these are baby boomer women, after all);
  • Women work disproportionately in the service-sector jobs, and service-sector employment as share of overall employment is still steadily rising (especially in highest-demand, health and human service occupations).  From BLS/Current Population Survey data, in 2017 women made up:
    • 56.6% of all service occupations (15.1 million/26.8 million jobs)
    • 87.1% of healthcare support occupations (3.06 million/3.51 million jobs)
    • 76.1% of personal care and services occupations (4.52 million/5.94 million jobs, 93.7% of childcare jobs and 83.7% of personal care aides)
    • 66.1% of community and social services occupations, especially social workers (82.5%)
    • Highest-shortage health occupations: 89.9% of registered nurses, 92.2% of nurse practitioners, 70.9% of physician assistants, 87.6% of occupational therapists;
    • Meanwhile, men still make up the majorities of goods-producing, “production” occupations (which are only 28.9% female), and these are jobs have been declining for decades as they’re more likely to be offshored or automated;
    • The jobs left to humans to deliver in-person services require more “soft skills” that women tend to be better at (and get better at with age).

In addition, life-cycle factors explain the rise of older women, in particular:

  • Women are relatively healthier (physically and cognitively/emotionally) at older ages;
  • Women are more “free” to participate in labor market after kids are grown (even if they have parental/elder care responsibilities);
  • Female educational attainment has been rising faster than for men, leading to career paths that have greater longevity (more cerebral, less physical). Women are thus becoming an increasing share of higher-skilled human capital.
  • These life-cycle factors imply that in contrast to men, market-based labor productivity for women tends to rise from their 30s and 40s to their 50s and 60s.

Finally, the increase in “flexible” and independent/contract work arrangements make it easier for these older women (and older men as well) to combine work with the rest of what they choose to do with their lives, thus making it more likely that age 55+ women will choose to stay in the workforce when in the past they might have more likely turned down the opportunity to work, if a standard 40-hours/week 9-to-5 job was their only work option. 

The rise of older women in the labor force is likely already affecting what the “new normal” of “full employment” looks like, and how well (or not so well) we are measuring it. Because older workers often consider themselves as on the cusp of retirement, it is common for them to move in and out of the definition of “labor force participation” depending on how actively they consider themselves as looking for work. Our economy’s true, potential labor force capacity is likely undercounted at any point in time as older workers may periodically yet not permanently self-identify themselves as out of the labor market (not working and not looking for work) and into retirement.  As Joseph Coughlin, Director of MIT’s AgeLab, argues in his 2017 book The Longevity Economy:

“Often, especially in the 60-plus set, older people who want to work but can’t find any simply say they’re retired. Traditional employment metrics fail to account for this population of would-be workers, which should technically be categorized as unemployed, not retired. And that population is sizable: In one major survey, 40 percent of people who described themselves as retired said they would have preferred to keep on working, and 30 percent said they would jump back into the workforce if the right job opened up.” (pg. 252)

So, there are more potential workers out there among the older population and so we might not yet be truly fully at our “full employment” capacity, but competition for these potential workers is still fierce. Given the rising role of older women in the workforce, employers would benefit from a shift in their mindsets and strategies to compete more effectively for them. They must stop thinking that all it takes is more money to attract and keep workers. The plus side from the employer’s perspective is that working women are more willing to trade off flexibility and other non-monetary perks against higher wages (which is one explanation for the gender pay gap), which has kept labor costs relatively low in this latest installment of “full employment” (which has relatively more older women in it than previous versions). In other words, the rise of women relative to men in the labor force—along with the relative increase in female-dominated and generally lower-paying service sector employment—may be one significant reason why wage growth in this economic recovery has not been as fast as expected or what we are used to experiencing. But it’s also a reason why we can think optimistically that the labor market (and our economy’s true capacity) still hasn’t maxed out.

  • About the Author:Diane Lim, PhD

    Diane Lim, PhD

    As Principal Economist, Diane Lim develops, conducts, and communicates research as part of The Conference Board’s economics and human capital practices. She studies and speaks on a wide variety …

    Full Bio | More from Diane Lim, PhD


0 Comment Comment Policy

Please Sign In to post a comment.

    hubCircleImage