August 21, 2020 | Chart

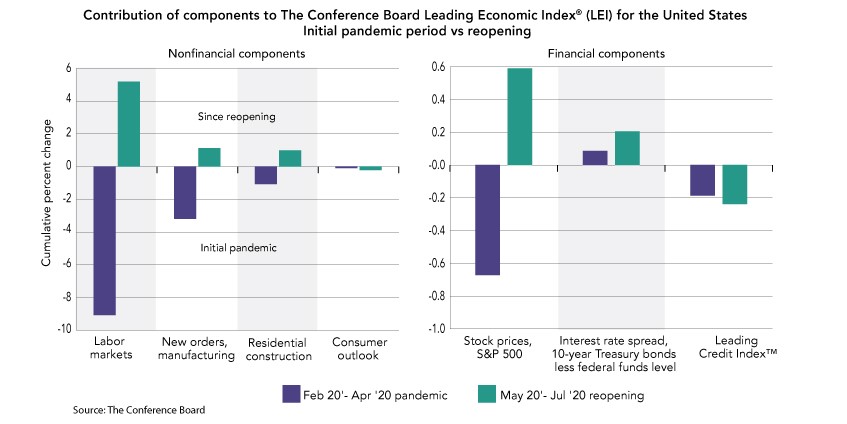
The reopening of the economy has created a rebound in parts of the economy since May. The Conference Board Leading Economic Index® (LEI)*for theUS, which is a composite average of ten components, has improved since reopening and increased further in July by 1.4 percent. However, the LEI is now still 13.4 percent lower than its peak in January 2020. If we look closer at the individual components of the LEI, we see that despite these modest improvements, some financial and nonfinancial components lag behind. The chart shows how much different components contributed to the decline in the LEI during the initial pandemic period (February to April) and to its rise during the reopening period (May to July). In the first period, all components went into contraction except the interest rate spread (purple bars). When parts of the economy began to reopen in May and June (green bars), labor markets and stock markets improved. However, gains in manufacturing and residential construction were dwarfed in comparison. Despite those positive signs, financial conditions measured by the Leading Credit Index™ and the consumer outlook on business conditions have both remained in the negative since May. This points to an economy with a high risk of losing steam at the end of the year. Without more broad-based improvement, the economy won’t have enough positive momentum to recover by year’s end, and it will take longer to get out of the deep COVID-19 recession.
*The LEI is a composite average of ten individual leading indicators and summarizes common trends in economic data. It helps to signal peaks and troughs in the business cycle and the future direction of the economy. For the latest data, press release, and technical notes visit our Business Cycle Indicators page.


July 27, 2022 | Newsletters & Alerts
