


Loading...


March ETI Steady Ahead of Tariff Announcement
Access Current & Historical Data
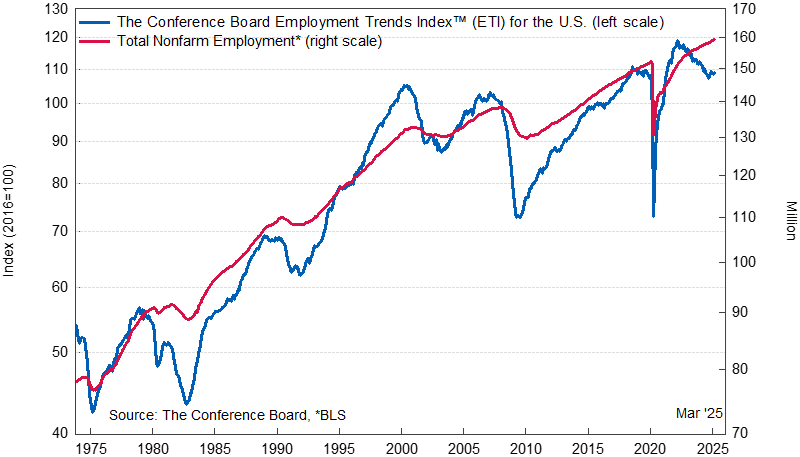
The Conference Board Employment Trends Index™ (ETI) increased in March to 109.03, from a downwardly revised 108.47 in February. The Employment Trends Index is a leading composite index for payroll employment. When the Index increases, employment is likely to grow as well, and vice versa. Turning points in the Index indicate that a change in the trend of job gains or losses is about to occur in the coming months.
“The ETI rose slightly from February’s five-month low,” said Mitchell Barnes, Economist at The Conference Board. “This ETI reading preceded the April 2 tariff announcement and suggests that the US labor market remained healthy in March.
Initial claims for unemployment insurance (an ETI component) declined in March following February’s increase, driven by federal and private-sector layoff announcements. The share of involuntary part-time workers declined to 17.4%, after reaching 18% in February—its highest level since 2021. The share of consumers who report ‘jobs are hard to get’—an ETI component from the Consumer Confidence Survey®—fell slightly in March to 15.7% after also peaking at a five-month high in February. The share of small firms that report jobs are ‘not able to be filled right now’ rose for the second consecutive month in March to 40%, the highest share since August 2024.
“The ETI suggests that labor demand remained healthy in March, while the layoffs that were announced did not yet translate to meaningful slack,” noted Barnes. “Over the course of 2025, government layoffs and the implementation of new tariffs could raise the unemployment rate from 4.2% in March to roughly 4.7%.”
Employment in the temporary-help industry declined for the third consecutive month in March, with losses now totaling 25,000 over the first quarter. Job openings missed forecasts in February, falling by nearly 200,000 after rising in January. Strength in industrial production and real manufacturing and trade sales since November are likely due in part to a ramp-up of activity ahead of new tariffs taking effect. But real sales for nondurables manufacturing, wholesale, and retail each showed weaker January data, in line with other first quarter spending indicators.
Barnes added, “While the US labor market held steady in March, declining confidence among businesses and consumers suggests that the labor market may face increasing headwinds moving forward.”
March’s increase in the Employment Trends Index was driven by positive contributions from 6 of its eight components: Ratio of Involuntarily Part-time to All Part-time Workers (US Bureau of Labor Statistics), the Percentage of Firms with Positions Not Able to Fill Right Now (© National Federation of Independent Business Research Foundation), Job Openings (US Bureau of Labor Statistics), the Percentage of Respondents Who Say They Find “Jobs Hard to Get” (The Conference Board Consumer Confidence Survey®), Initial Claims for Unemployment Insurance (US Department of Labor), and Industrial Production (Federal Reserve Board).
The Employment Trends Index aggregates eight leading indicators of employment, each of which has proven accurate in its own area. Aggregating individual indicators into a composite index filters out “noise” to show underlying trends more clearly.
The Conference Board Employment Trends Index ™, November 1973 to Present
The eight leading indicators of employment aggregated into the Employment Trends Index include:
*Statistical imputation for the recent month
**Statistical imputation for two most recent months
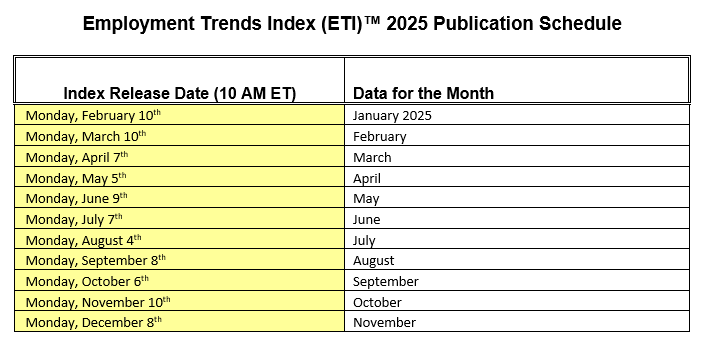
The Conference Board publishes the Employment Trends Index monthly, at 10 a.m. ET, on the Monday that follows each Friday release of the Bureau of Labor Statistics Employment Situation report. The technical notes to this series are available on The Conference Board website: http://www.conference-board.org/data/eti.cfm.
About The Conference Board
The Conference Board is the member-driven think tank that delivers Trusted Insights for What’s Ahead®. Founded in 1916, we are a non-partisan, not-for-profit entity holding 501 (c) (3) tax-exempt status in the United States. www.conference-board.org.
For further information contact:
Jonathan Liu
jliu@tcb.org
Joseph DiBlasi
781.308.7935
jdiBlasi@tcb.org
Methodology
April 07, 2025
Connect and be informed about this topic through webcasts, virtual events and conferences
All release times displayed are Eastern Time

March Payrolls: The Calm Before the Tariff Storm
April 04, 2025 | Brief
February Jobs Report Hints at Growing Uncertainty
March 07, 2025 | Brief
Q4 ECI Wage Deceleration Slows
February 07, 2025 | Brief
Stability Underneath January’s Noisy Jobs Report
February 07, 2025 | Brief
January 10, 2025 | Brief
November Job Gains Rebound from Disruptions
December 06, 2024 | Brief

Labor Markets Watch: Trade Wars, Industrial Agendas, and Workforce Readiness
May 21, 2025 01:00 PM ET (New York)
