


Loading...
Database
Track the economy’s current state and future direction with our Recession & Growth Trackers, updated monthly for 16 countries and regions.
This tool allows Members to easily see the current and future state of each economy in 4 quadrants:
expansion slowdown recession recovery
Members can also explore the database to compare historical data across economies.
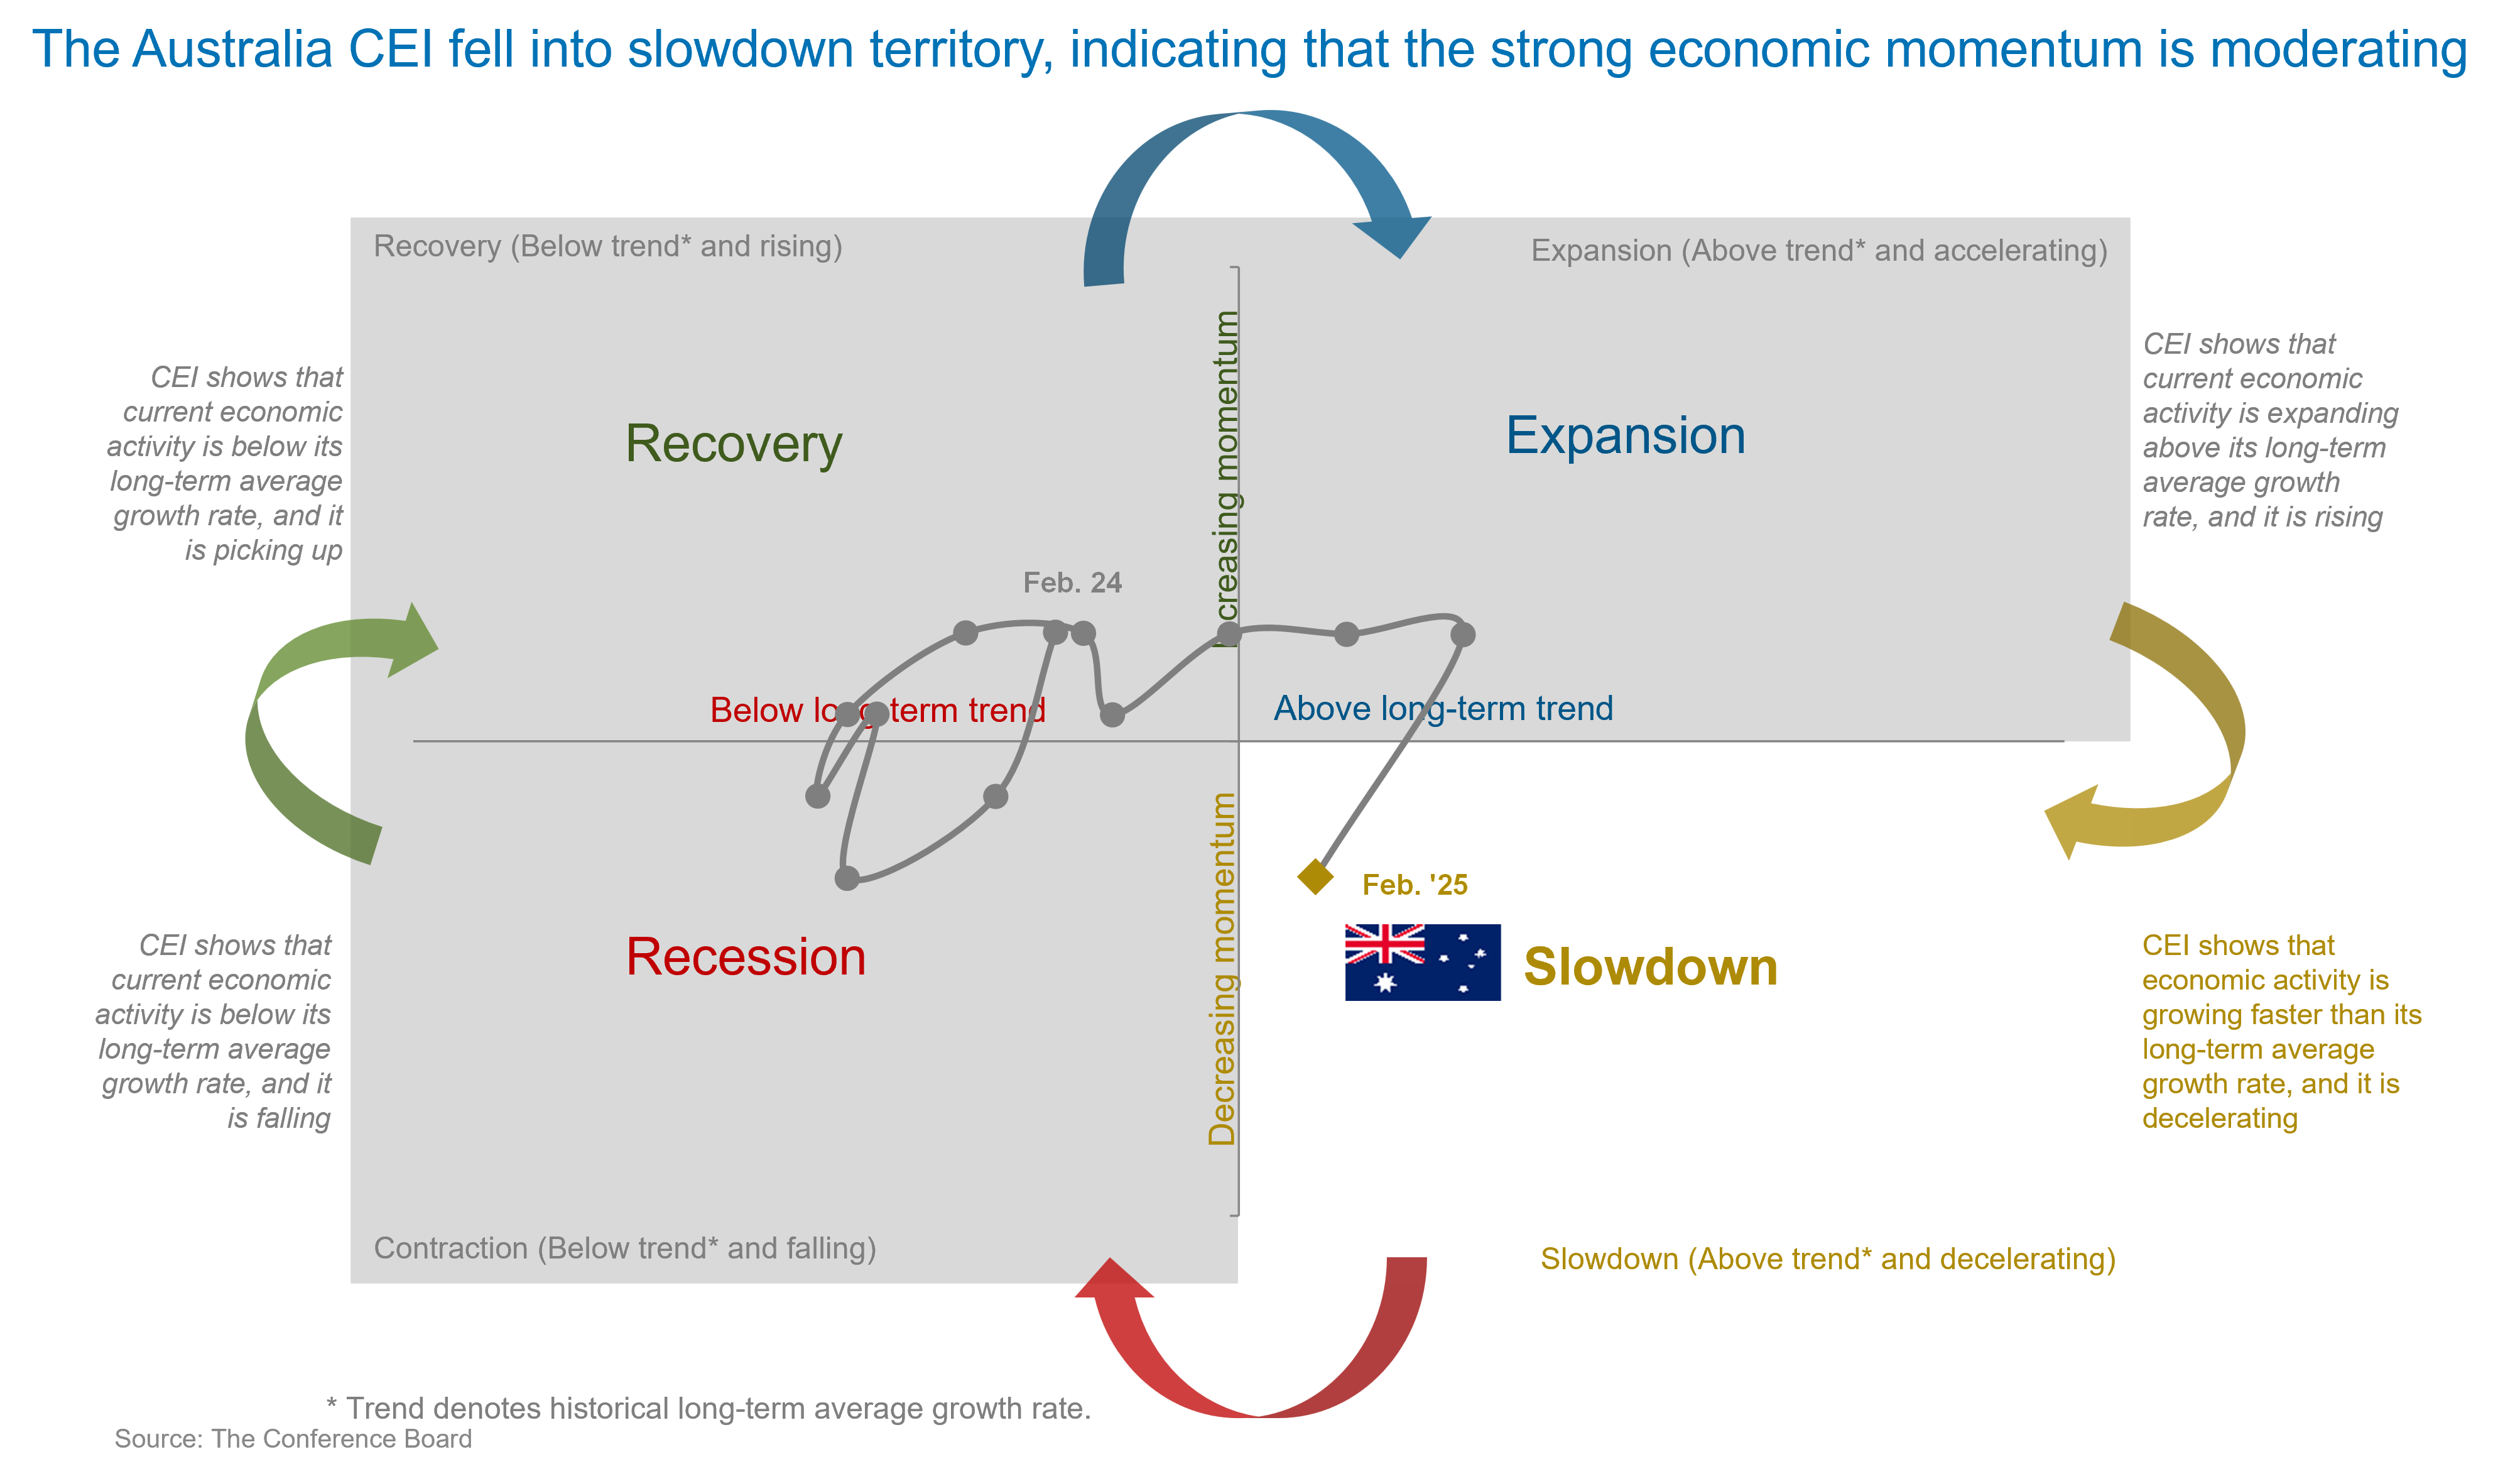
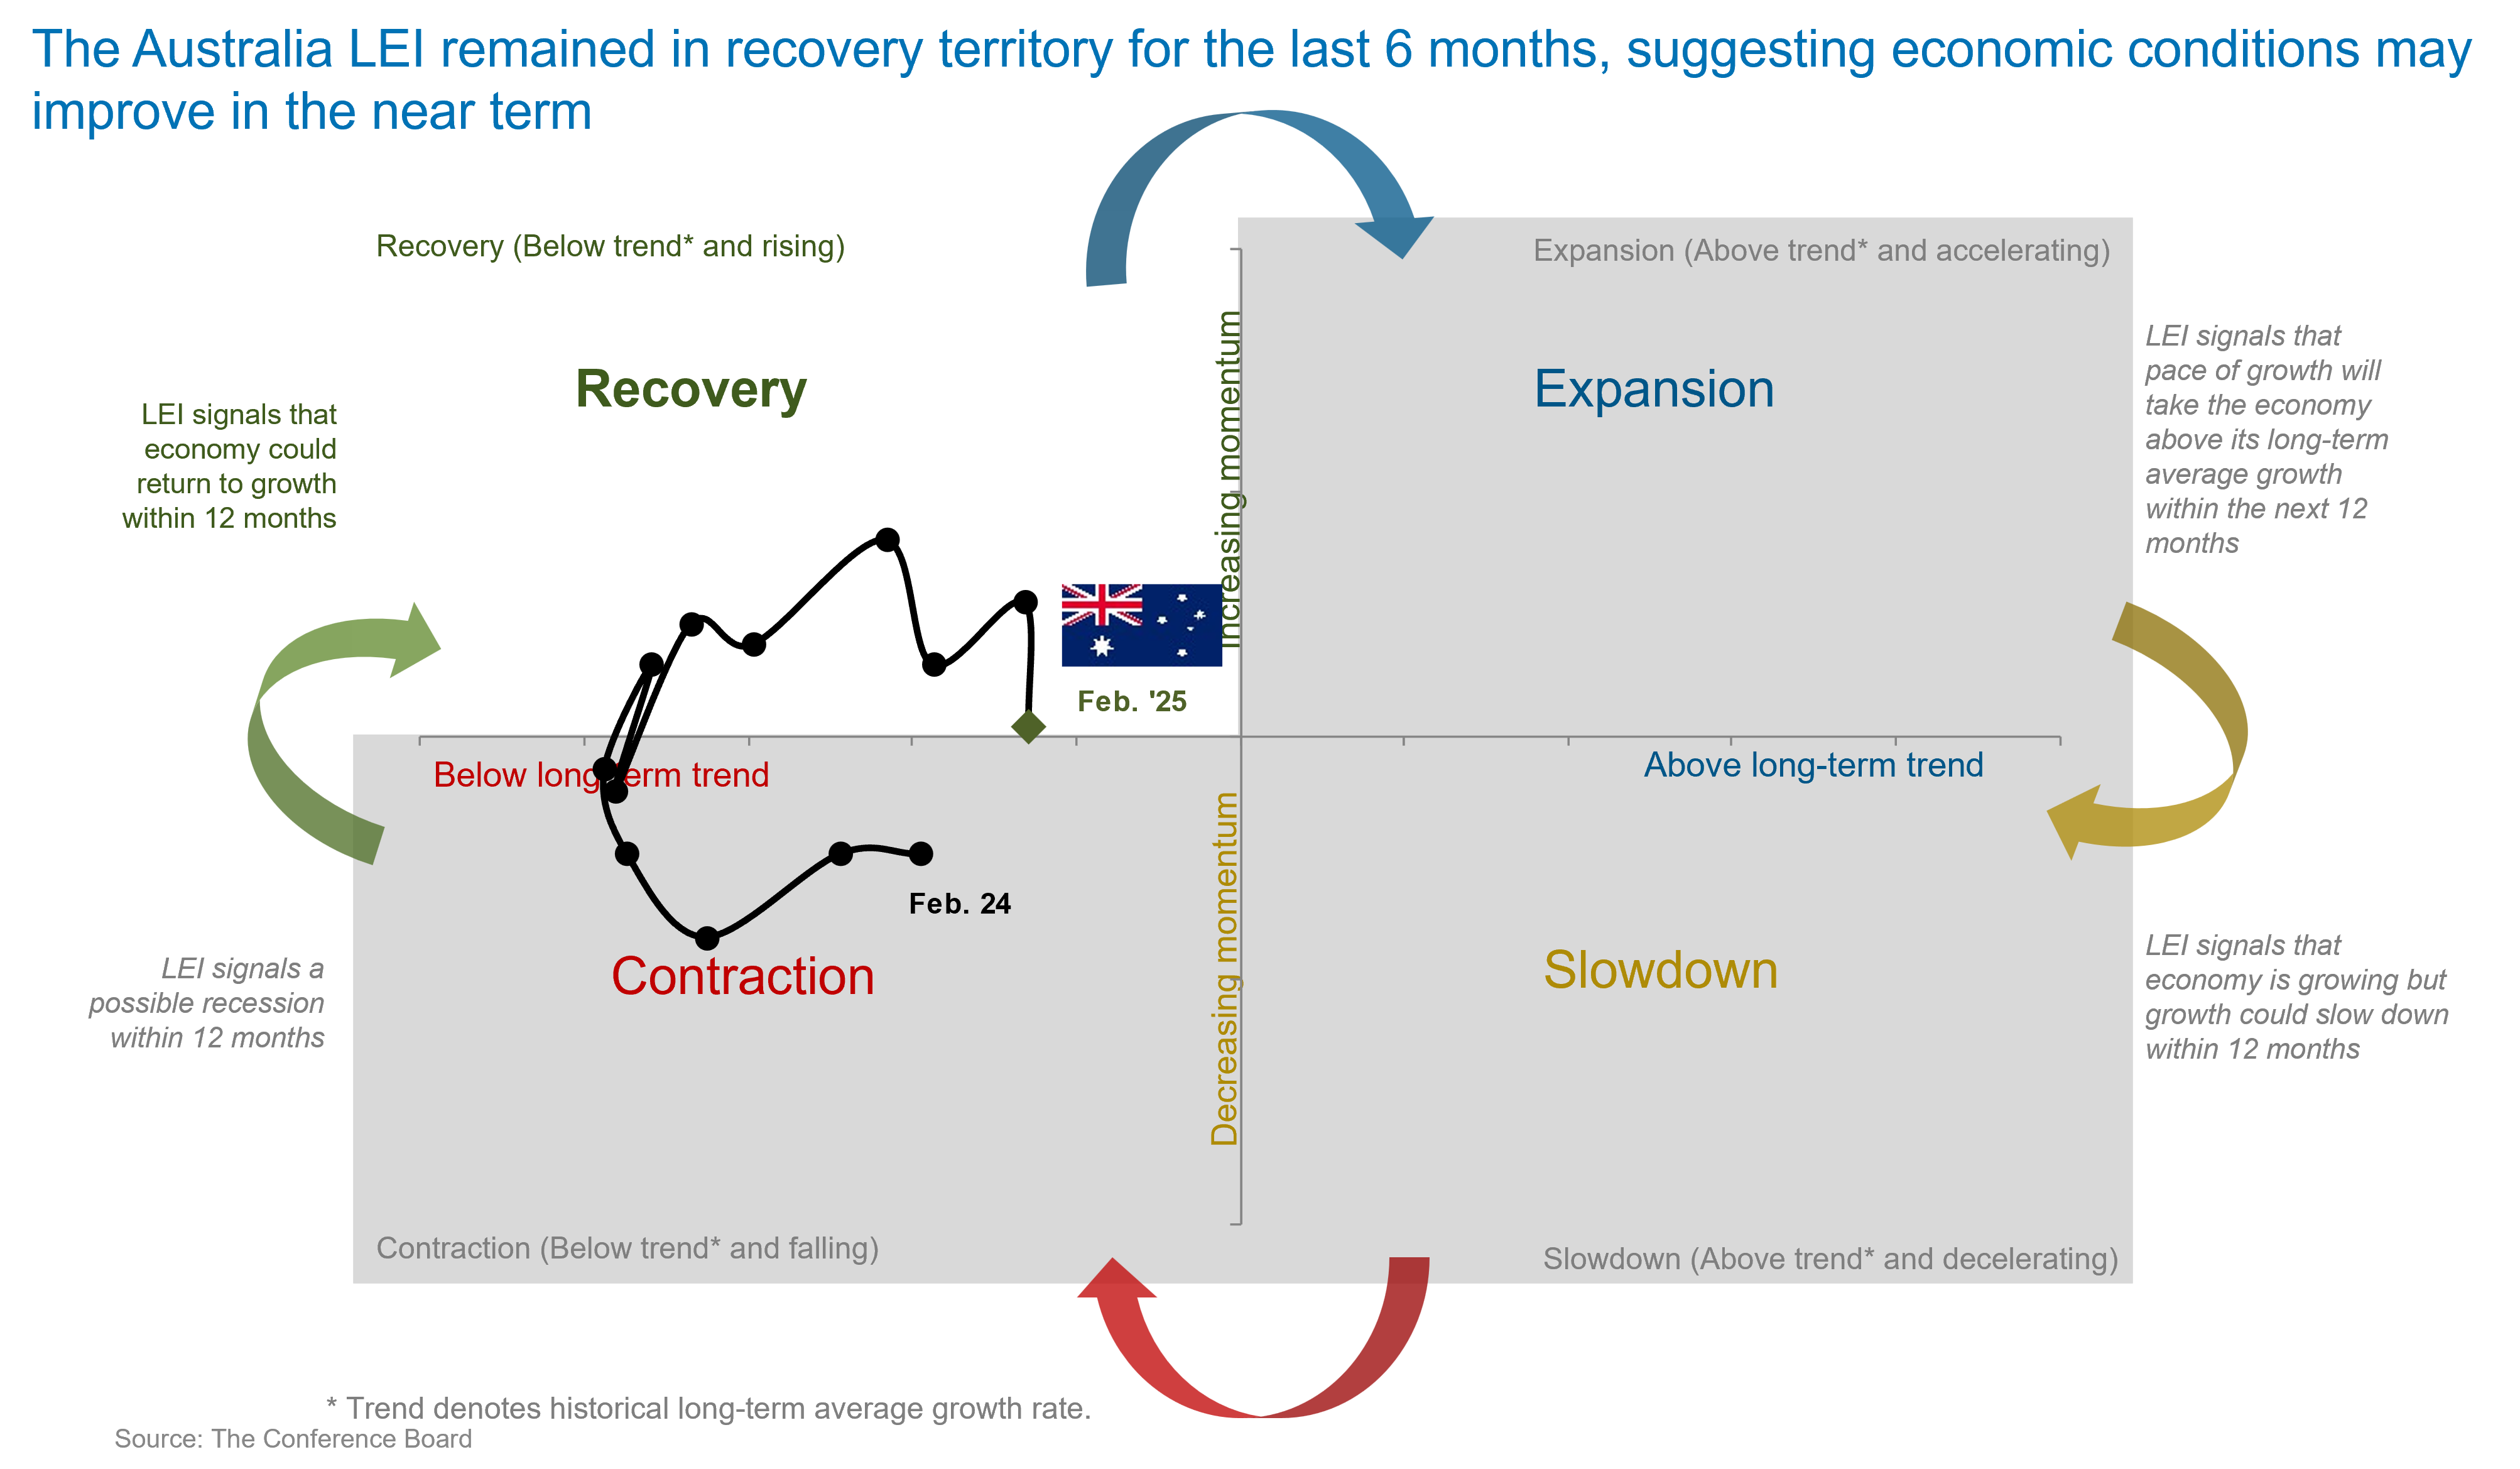
Recession & Growth Trackers are analytical tools based on composite business cycle indicators from The Conference Board: The Conference Board Leading Economic Index® (LEI) and The Conference Board Coincident Economic Index® (CEI).
In other words, the LEI provides a signal about the future state of the economy, while CEI is used to confirm that signal a few months later.
The quadrants are determined by estimating whether the index is above or below its long-term average growth rate (trend) and whether the index is moving away from or closer to this trend.
Scroll Down or use the "Select by Country" dropdown menu above
Members of The Conference Board get exclusive access to Trusted Insights for What’s Ahead® through publications, Conferences and events, webcasts, podcasts, data & analysis, and Member Communities.
