


Loading...


Using the Composite Indexes: The Leading Economic Index (LEI) provides an early indication of significant turning points in the business cycle and where the economy is heading in the near term. The Coincident Economic Index (CEI) provides an indication of the current state of the economy. Additional details are below.
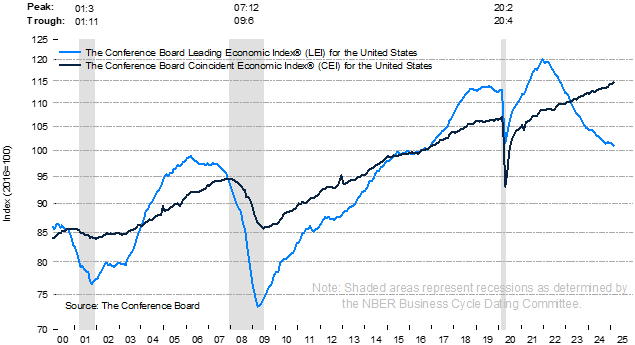
The Conference Board Leading Economic Index® (LEI) for the US declined by 0.3% in February 2025 to 101.1 (2016=100), after a 0.2% decline (revised from –0.3%) in January. Overall, the LEI fell by 1.0% in the six-month period ending February 2025, less than half of its rate of decline of –2.1% over the previous six months (February–August 2024).
“The US LEI fell again in February and continues to point to headwinds ahead,” said Justyna Zabinska-La Monica, Senior Manager, Business Cycle Indicators, at The Conference Board. “Consumers’ expectations of future business conditions turned more pessimistic. That was the component that weighed down most heavily on the Index in February. Manufacturing new orders, which improved in January, retreated and were the second largest negative contributor to the Index’s monthly decline. On a positive note, the LEI’s six-month and annual growth rates, while still negative, have remained on an upward trend since the end of 2023, suggesting that headwinds in the economy as of February may have moderated compared to last year. However, given substantial policy uncertainty and the notable pullback in consumer sentiment and spending since the beginning of the year, we currently forecast that real GDP growth in the US will slow to around 2.0% in 2025.”
The Conference Board Coincident Economic Index® (CEI) for the US increased by 0.3% in February 2025 to 114.7 (2016=100), after a 0.2% increase in January. As a result, the CEI rose by 1.2% over the six-month period between August 2024 and February 2025, twice its 0.6% growth over the previous six months. The CEI’s four component indicators—payroll employment, personal income less transfer payments, manufacturing and trade sales, and industrial production—are included among the data used to determine recessions in the US. They all improved in February, with the largest positive contribution coming from industrial production, followed by personal income less transfer payments, manufacturing and trade sales, and payroll employment.
The Conference Board Lagging Economic Index® (LAG) for the US increased by 0.4% to 119.1 (2016=100) in February 2025, after a 0.3% increase in January. As a result, the LAG’s six-month change turned positive, rising 0.2% between August 2024 and February 2025—a reversal of its 0.2% decline from over the previous six months.


NOTE: The chart illustrates the so-called 3Ds—duration, depth, and diffusion—for interpreting a downward movement in the LEI. Duration refers to how long the decline has lasted. Depth denotes the size of decline. Duration and depth are measured by the rate of change of the index over the most recent six months. Diffusion is a measure of how widespread the decline is among the LEI’s component indicators—on a scale of 0 to 100, a diffusion index reading below 50 indicates most components are weakening.
The 3Ds rule signals an impending recession when: 1) the six-month diffusion index lies at or below 50, shown by the black warning signal lines in the chart; and 2) the LEI’s six-month rate of decline falls below the threshold of −4.2%. The red recession signal lines indicate months when both criteria are met simultaneously—and thus that a recession is likely imminent or underway.

About The Conference Board Leading Economic Index® (LEI) and Coincident Economic Index® (CEI) for the US
The composite economic indexes are key elements in an analytic system designed to signal peaks and troughs in the business cycle. Comprised of multiple independent indicators, the indexes are constructed to summarize and reveal common turning points in the economy in a clearer and more convincing manner than any individual component.
The CEI reflects current economic conditions and is highly correlated with real GDP. The LEI is a predictive tool that anticipates—or “leads”—turning points in the business cycle by around seven months.
The ten components of the Leading Economic Index® for the US are:
• Average weekly hours in manufacturing
• Average weekly initial claims for unemployment insurance
• Manufacturers’ new orders for consumer goods and materials
• ISM® Index of New Orders
• Manufacturers’ new orders for nondefense capital goods excluding aircraft orders
• Building permits for new private housing units
• S&P 500® Index of Stock Prices
• Leading Credit Index™
• Interest rate spread (10-year Treasury bonds less federal funds rate)
• Average consumer expectations for business conditions
The four components of the Coincident Economic Index® for the US are:
• Payroll employment
• Personal income less transfer payments
• Manufacturing and trade sales
• Industrial production
To access data, please visit: https://data-central.conference-board.org/
About The Conference Board
The Conference Board is the member-driven think tank that delivers Trusted Insights for What’s Ahead®. Founded in 1916, we are a non-partisan, not-for-profit entity holding 501 (c) (3) tax-exempt status in the United States. ConferenceBoard.org
The next release is scheduled for Monday, April 21 at 10 A.M. ET
For further information contact:
Joseph DiBlasi
781.308.7935
jdiBlasi@tcb.org
Jonathan Liu
jliu@tcb.org
With graph and summary table
March 20, 2025
Connect and be informed about this topic through webcasts, virtual events and conferences
PRESS RELEASE
US Leading Economic Index® Fell Further in February
March 20, 2025
PRESS RELEASE
US Leading Economic Index® Declined in January
February 20, 2025
PRESS RELEASE
US Leading Economic Index® Decreased in December
January 22, 2025
PRESS RELEASE
US Leading Economic Index® Increased in November
December 19, 2024
PRESS RELEASE
US Leading Economic Index® Fell in October
November 21, 2024
PRESS RELEASE
US Leading Economic Index® Declined in September
October 21, 2024
All release times displayed are Eastern Time
Charts
The Conference Board Leading Economic Index® (LEI) for the US rose sharply in August and remains on a rapidly rising trajectory. The strengths among the leading indic…
LEARN MORECharts
The Conference Board Leading Economic Index® (LEI) for the United States continued to improve in August, but a recession signal derived from the index has continued t…
LEARN MORECharts
The Conference Board Leading Economic Index®(LEI) for the US dropped 4.4 percent in April, following a decline of 7.4 percent in March.
LEARN MORETechnical Notes for the US LEI
March 20, 2025 | Guide & Reference

June 17, 2022 | Report
April 21, 2022 | Report
August US leading index points to continued economic growth
September 23, 2021 | Chart
US LEI improving, but recession signal remains
September 24, 2020 | Chart
LEI points to a deep recession with no sign of fast rebound
May 21, 2020 | Chart

The Long-term Economic Outlook for the US, Europe, and China
December 11, 2024 11:00 AM ET (New York)
The Evolving Economic Outlook for Europe
July 10, 2024 11:00 AM ET (New York)
What Are The Conference Board LEIs Telling Us About the Future?
April 10, 2024 11:00 AM ET (New York)
Inflation, Labor Markets, and the Fed
May 11, 2022 11:00 AM ET (New York)
